


 本文介绍了一种使用 JIT 框架实现拓扑结构展示的方法,详细展示了 HTML 和 JavaScript 代码示例,包括如何配置节点样式和动画效果。
近期在项目中需要展现拓扑结构,综合了比较了几种JS框架(d3个人感觉有点胖没有考虑):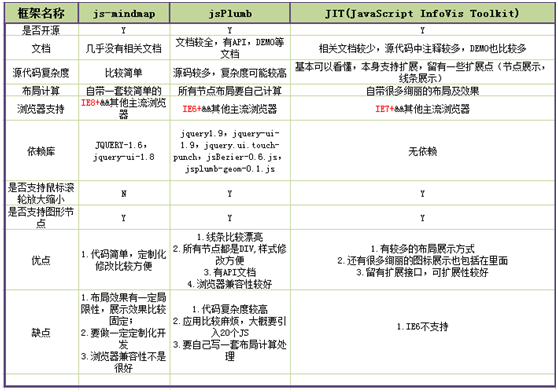
选这个框架原因主要有以下几点:
1. 依赖关系较少,和公司已有的nui框架可以很好的结合
2. 展示效果相对比较好
3. 可扩展性较好
进入正题,先上一张效果图: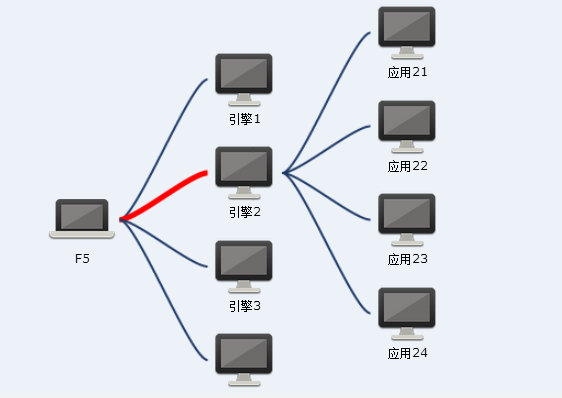
示例代码,html部分:
<!DOCTYPE html PUBLIC "-//W3C//DTD XHTML 1.0 Transitional//EN" "http://www.w3.org/TR/xhtml1/DTD/xhtml1-transitional.dtd">
<html xmlns="http://www.w3.org/1999/xhtml">
<head>
<meta http-equiv="Content-Type" content="text/html; charset=UTF-8" />
<title>拓扑测试</title>

<!-- CSS Files -->
<link type="text/css" href="./css/base.css" rel="stylesheet" />
<link type="text/css" href="./css/Spacetree.css" rel="stylesheet" />

<!--[if IE]><script language="javascript" type="text/javascript" src="./js/Extras/excanvas.js"></script><![endif]-->

<!-- JIT Library File -->
<script language="javascript" type="text/javascript" src="./js/jit.js"></script>

<!-- js File -->
<script language="javascript" type="text/javascript" src="topo.js"></script>
</head>

<body onload="init();">
    <div id="infovis"  style="width:100%;height:500px;background:#edf2f9"></div>
</body>
</html>
js部分:
var labelType, useGradients, nativeTextSupport, animate;

(function() {
  var ua = navigator.userAgent,
      iStuff = ua.match(/iPhone/i) || ua.match(/iPad/i),
      typeOfCanvas = typeof HTMLCanvasElement,
      nativeCanvasSupport = (typeOfCanvas == 'object' || typeOfCanvas == 'function'),
      textSupport = nativeCanvasSupport
        && (typeof document.createElement('canvas').getContext('2d').fillText == 'function');
  //I'm setting this based on the fact that ExCanvas provides text support for IE
  //and that as of today iPhone/iPad current text support is lame
  labelType = (!nativeCanvasSupport || (textSupport && !iStuff))? 'Native' : 'HTML';
  nativeTextSupport = labelType == 'Native';
  useGradients = nativeCanvasSupport;
  animate = !(iStuff || !nativeCanvasSupport);
})();


function init(){
    //实例数据
    var json = {
        id: "0",
        name: "F5",
        data: {
        	type:'F5'
        },
        children: [ {id: "1",
             name: "引擎1",
             data: {type:'server'}
            },{
            id: "2",
            name: "引擎2",
            data: {},
             children: [{
		            id: "21",
		            name: "应用21",
		            data: {}
		            }, {
		        	 id: "22",
		             name: "应用22",
		             data: {type:'server'}
		            }, {
		        	id: "23",
		            name: "应用23",
		            data: {type:'server'}
		            }, {
		        	id: "24",
		            name: "应用24",
		            data: {type:'server'}
		           }]
            },
        	 {
        	id: "3",
            name: "引擎3",
            data: {type:'server'}
            }, {
        	id: "5",
            name: "引擎4",
            data: {type:'server'}
           }]
    };
    //end

    //创建一个 ST 实例
    var st = new $jit.ST({
        //渲染容器,一般是一个DIV
        injectInto: 'infovis',
        //展示出拓扑图的动画时间
        duration: 800,
        //设置动画类型
        transition: $jit.Trans.Quart.easeInOut,
        //设置横向节点距离
        levelDistance: 80,
        //点击节点后下级几点展示几层
        levelsToShow: 5,
        //是否可以移动
        Navigation: {
          enable:false,
          panning:false
        },
        //节点类型样式设置,节点类型支持扩展
        Node: {
            height: 80,
            width: 68,
            type: 'rectangle',
            lineWidth: 2,
            overridable: true
        },
        //线条类型(bezier,line,arrow,quadratic:begin,quadratic:end)样式设置
        Edge: {
        	type: 'bezier',
            lineWidth: 2,
            color:'#203b68',
            overridable: true
        },

        //计算节点位置前
        onBeforeCompute: function(node){

        },
        //计算节点位置后
        onAfterCompute: function(){

        },

        //创建节点文本时触发事件
        onCreateLabel: function(label, node){
            label.id = node.id;
            label.innerHTML = node.name;
            label.onclick = function(){
            	  st.onClick(node.id);
            };
            var style = label.style;
            style.width = 68 + 'px';
            style.height = 80 + 'px';
            style.lineHeight= 150 + 'px';
            style.cursor = 'pointer';
            style.color = '#000000';//'#c5c4c4';
            style.fontSize = '0.8em';
            style.textAlign= 'center';
            style.verticalAlign='bottom';
            style.background=node.data.type=='F5'?"url('./icon/f5.png') no-repeat top":"url('./icon/server.png') no-repeat top";
        },


        //渲染节点触发事件
        onBeforePlotNode: function(node){

        },


        //连线前触发事件,可以修改线条颜色等
        onBeforePlotLine: function(adj){
            if (adj.nodeFrom.selected && adj.nodeTo.selected) {
                adj.data.$color = "#FF0000";
                adj.data.$lineWidth = 5;
            }
            else {
                delete adj.data.$color;
                delete adj.data.$lineWidth;
            }
        }
    });
    //加载数据
    st.loadJSON(json);
    //计算布局
    st.compute();
    //整体渲染
    st.geom.translate(new $jit.Complex(-200, 0), "current");
    //展现根节点
    st.onClick(st.root);
}
引用类库及完整示例代码在附件中


 2862
2862

 被折叠的 条评论
为什么被折叠?
被折叠的 条评论
为什么被折叠?
 到【灌水乐园】发言


