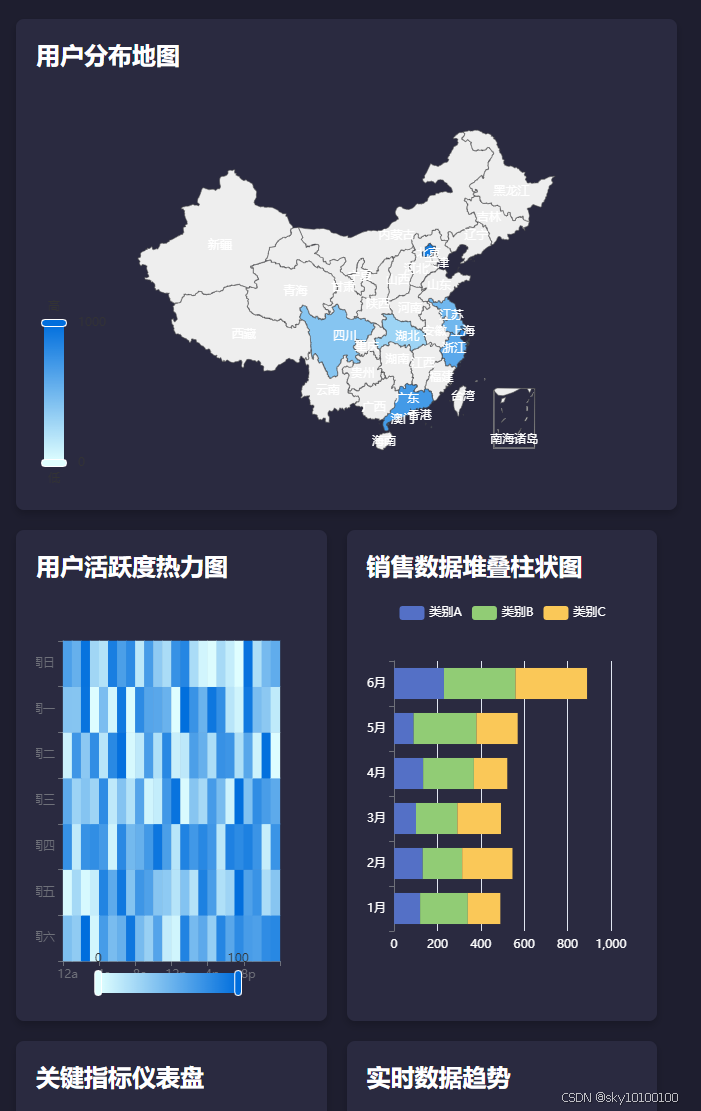
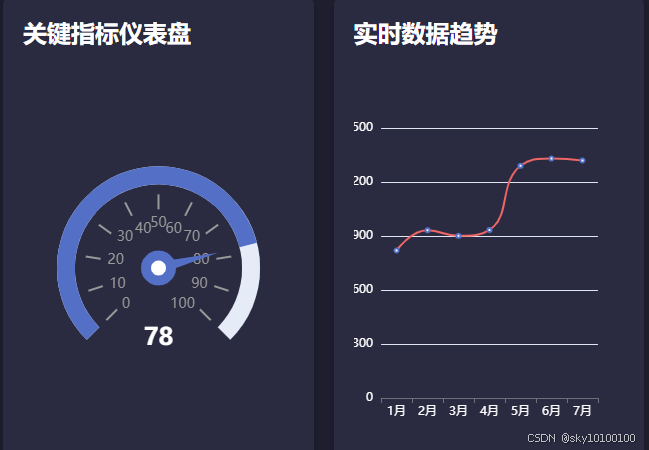
效果图:
完整代码
<!DOCTYPE html>
<html>
<head>
<meta charset="utf-8">
<title>复杂可视化智慧大屏 - ECharts + Vue2</title>
<script src="https://cdn.jsdelivr.net/npm/vue@2"></script>
<script src="https://cdn.jsdelivr.net/npm/echarts@5.4.2/dist/echarts.min.js"></script>
<script src="https://cdn.jsdelivr.net/npm/echarts/map/js/china.js"></script>
<style>
body {
font-family: Arial, sans-serif;
background-color: #1e1e2f;
color: #fff;
margin: 0;
padding: 0;
}
.dashboard {
display: flex;
flex-wrap: wrap;
padding: 20px;
}
.card {
background: #2a2a40;
border-radius: 8px;
box-shadow: 0 4px 8px rgba(0, 0, 0, 0.2);
margin: 10px;
padding: 20px;
box-sizing: border-box;
}
.card h2 {
margin-top: 0;
color: #fff;
}
.chart {
width: 100%;
height: 400px;
}
.full-width {
width: calc(100% - 40px);
}
.half-width {
width: calc(50% - 40px);
}
</style>
</head>
<body>
<div id="app">
<div class="dashboard">
<div class="card full-width">
<h2>用户分布地图</h2>
<div class="chart" ref="mapChart"></div>
</div>
<div class="card half-width">
<h2>用户活跃度热力图</h2>
<div class="chart" ref="heatmapChart"></div>
</div>
<div class="card half-width">
<h2>销售数据堆叠柱状图</h2>
<div class="chart" ref="stackedBarChart"></div>
</div>
<div class="card half-width">
<h2>关键指标仪表盘</h2>
<div class="chart" ref="gaugeChart"></div>
</div>
<div class="card half-width">
<h2>实时数据趋势</h2>
<div class="chart" ref="lineChart"></div>
</div>
</div>
</div>
<script>
new Vue({
el: '#app',
mounted() {
this.initMapChart();
this.initHeatmapChart();
this.initStackedBarChart();
this.initGaugeChart();
this.initLineChart();
},
methods: {
initMapChart() {
const chart = echarts.init(this.$refs.mapChart);
const option = {
tooltip: {
trigger: 'item',
formatter: '{b}: {c}'
},
visualMap: {
min: 0,
max: 1000,
left: 'left',
top: 'bottom',
text: ['高', '低'],
calculable: true,
inRange: {
color: ['#e0ffff', '#006edd']
}
},
series: [{
name: '用户分布',
type: 'map',
mapType: 'china',
roam: true,
label: {
show: true,
color: '#fff'
},
data: [
{ name: '北京', value: 900 },
{ name: '上海', value: 800 },
{ name: '广东', value: 700 },
{ name: '浙江', value: 600 },
{ name: '江苏', value: 500 },
{ name: '四川', value: 400 },
{ name: '湖北', value: 300 }
]
}]
};
chart.setOption(option);
},
initHeatmapChart() {
const chart = echarts.init(this.$refs.heatmapChart);
const hours = ['12a', '1a', '2a', '3a', '4a', '5a', '6a', '7a', '8a', '9a', '10a', '11a',
'12p', '1p', '2p', '3p', '4p', '5p', '6p', '7p', '8p', '9p', '10p', '11p'];
const days = ['周六', '周五', '周四', '周三', '周二', '周一', '周日'];
const data = [];
for (let i = 0; i < 7; i++) {
for (let j = 0; j < 24; j++) {
data.push([j, i, Math.random() * 100]);
}
}
const option = {
tooltip: {
position: 'top'
},
grid: {
height: '80%',
top: '10%'
},
xAxis: {
type: 'category',
data: hours,
splitArea: {
show: true
}
},
yAxis: {
type: 'category',
data: days,
splitArea: {
show: true
}
},
visualMap: {
min: 0,
max: 100,
calculable: true,
orient: 'horizontal',
left: 'center',
bottom: '0%',
inRange: {
color: ['#e0ffff', '#006edd']
}
},
series: [{
name: '活跃度',
type: 'heatmap',
data: data,
label: {
show: false
},
emphasis: {
itemStyle: {
shadowBlur: 10,
shadowColor: 'rgba(0, 0, 0, 0.5)'
}
}
}]
};
chart.setOption(option);
},
initStackedBarChart() {
const chart = echarts.init(this.$refs.stackedBarChart);
const option = {
tooltip: {
trigger: 'axis',
axisPointer: {
type: 'shadow'
}
},
legend: {
data: ['类别A', '类别B', '类别C'],
textStyle: {
color: '#fff'
}
},
xAxis: {
type: 'value',
axisLabel: {
color: '#fff'
}
},
yAxis: {
type: 'category',
data: ['1月', '2月', '3月', '4月', '5月', '6月'],
axisLabel: {
color: '#fff'
}
},
series: [
{
name: '类别A',
type: 'bar',
stack: '总量',
data: [120, 132, 101, 134, 90, 230],
itemStyle: {
color: '#5470c6'
}
},
{
name: '类别B',
type: 'bar',
stack: '总量',
data: [220, 182, 191, 234, 290, 330],
itemStyle: {
color: '#91cc75'
}
},
{
name: '类别C',
type: 'bar',
stack: '总量',
data: [150, 232, 201, 154, 190, 330],
itemStyle: {
color: '#fac858'
}
}
]
};
chart.setOption(option);
},
initGaugeChart() {
const chart = echarts.init(this.$refs.gaugeChart);
const option = {
tooltip: {
formatter: '{a} <br/>{b} : {c}%'
},
series: [{
name: '关键指标',
type: 'gauge',
progress: {
show: true,
width: 18
},
axisLine: {
lineStyle: {
width: 18
}
},
axisTick: {
show: false
},
splitLine: {
length: 15,
lineStyle: {
width: 2,
color: '#999'
}
},
axisLabel: {
distance: 25,
color: '#999',
fontSize: 14
},
anchor: {
show: true,
showAbove: true,
size: 25,
itemStyle: {
borderWidth: 10
}
},
title: {
show: false
},
detail: {
valueAnimation: true,
fontSize: 24,
offsetCenter: [0, '70%'],
color: '#fff'
},
data: [{
value: 78,
name: '完成率'
}]
}]
};
chart.setOption(option);
},
initLineChart() {
const chart = echarts.init(this.$refs.lineChart);
const option = {
tooltip: {
trigger: 'axis'
},
xAxis: {
type: 'category',
data: ['1月', '2月', '3月', '4月', '5月', '6月', '7月'],
axisLabel: {
color: '#fff'
}
},
yAxis: {
type: 'value',
axisLabel: {
color: '#fff'
}
},
series: [{
data: [820, 932, 901, 934, 1290, 1330, 1320],
type: 'line',
smooth: true,
lineStyle: {
color: '#ee6666'
}
}]
};
chart.setOption(option);
}
}
});
</script>
</body>
</html>


 524
524

 被折叠的 条评论
为什么被折叠?
被折叠的 条评论
为什么被折叠?
 到【灌水乐园】发言


