


 本文详细介绍了Python数据清洗的各种方法,包括使用pandas的split、merge、数据类型转换、正则表达式清洗字符串、处理缺失值和重复数据,以及数据整合和测试。涉及pd.melt、pd.merge、pd.to_numeric等函数,还提到了glob.glob()查找匹配文件和assert进行数据验证。
1. 函数
pd.melt()、pd.merge()、.pivot_table()、pd.to_numeric()、pd.reset_index()、pd.concat()、.astype()、.info()、.get().str.contains()、.dropna() 、.to_csv()、.groupby()、.plot() 、.all().all()、glob.glob()、.dropna() 、.value_counts() 、.drop_duplicates()、.fillna()、df.apply(np.mean, axis=0)、.plot(kind=' ')
Python3 pandas(3)筛选数据isin(), str.contains()
pandas中关于set_index和reset_index的用法
8个数据清洗Python代码,复制可用,最长11行 | 资源
pandas.melt(frame, id_vars=None, value_vars=None, var_name=None, value_name='value', col_level=None)
frame:要处理的数据集。

id_vars:不需要被转换的列名。

value_vars:需要转换的列名,如果剩下的列全部都要转换,就不用写了。

var_name和value_name是自定义设置对应的列名。

col_level :如果列是MultiIndex,则使用此级别。
Splitting a column with .str
tb融化保持'country'和'year'固定。'gender'通过对variable列的第一个字母进行切片来创建一列tb_melt。- 创建一个
'age_group'由切片其余列variable的列tb_melt。
# Melt tb: tb_melt
tb_melt = pd.melt(tb, id_vars=['country','year'])

# Create the 'gender' column
tb_melt['gender'] = tb_melt.variable.str[0]

# Create the 'age_group' column
tb_melt['age_group'] = tb_melt.variable.str[1:]

# Print the head of tb_melt
print(tb_melt.head())
Splitting a column with .split() and .get()
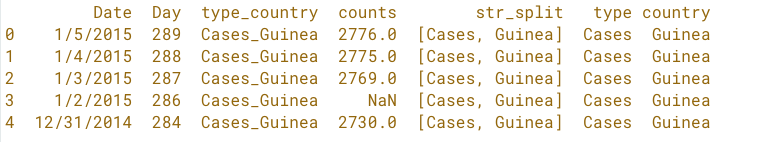
ebola使用'Date'和'Day'作为id_vars,'type_country'作为var_name,和'counts'作为融化value_name。'str_split'通过拆分on 的'type_country'列来创建一个列。请注意,您必须先访问的属性,然后才能使用。ebola_melt'_'strtype_country.split()'type'使用.get()方法检索0的'str_split'列索引创建一个列ebola_melt。'country'使用.get()方法检索1的'str_split'列索引创建一个列ebola_melt。
.get()访问.str属性后,使用方法ebola_melt.str_split检索索引0和1。
要创建'str_split'列,请访问的.str属性,ebola_melt.type_country然后将.split()with '_'作为参数使用方法。
# Melt ebola: ebola_melt
ebola_melt = pd.melt(ebola, id_vars=['Date', 'Day'], var_name='type_country', value_name='counts')
# print(ebola_melt)
# Create the 'str_split' column
ebola_melt['str_split'] = ebola_melt.type_country.str.split('_')
# print(ebola_melt['str_split'])

# Create the 'type' column
ebola_melt['type'] = ebola_melt.str_split.str.get(0)

# Create the 'country' column
ebola_melt['country'] = ebola_melt.str_split.str.get(1)

# Print the head of ebola_melt
print(ebola_melt.head())
Combining rows of data
串联uber1,uber2和uber3一起使用pd.concat()。您必须将DataFrames作为列表传递。
# Concatenate uber1, uber2, and uber3: row_concat
row_concat = pd.concat([uber1,uber2,uber3])

# Print the shape of row_concat
print(row_concat.shape)

# Print the head of row_concat
print(row_concat.head())
pd.concat()功能,使用关键字axis=1从列级联。默认axis=0值为行级联。
# Concatenate ebola_melt and status_country column-wise: ebola_tidy
ebola_tidy = pd.concat([ebola_melt,status_country],axis=1)

# Print the shape of ebola_tidy
print(ebola_tidy.shape)

# Print the head of ebola_tidy
print(ebola_tidy.head())
Finding and concatenating data
Finding files that match a pattern
glob.glob()函数得到所有匹配的文件名列表
# Import necessary modules
import glob
import pandas as pd

# Write the pattern: pattern
pattern = '*.csv'

# Save all file matches: csv_files
csv_files = glob.glob(pattern)

# Print the file names
print(csv_files)

# Load the second file into a DataFrame: csv2
csv2 = pd.read_csv(csv_files[1])

# Print the head of csv2
print(csv2.head())
将得到的文件列表作为pd.concat()的参数,串联所有文件
# Create an empty list: frames
frames = []

#  Iterate over csv_files
for csv in csv_files:

    #  Read csv into a DataFrame: df
    df = pd.read_csv(csv)

    # Append df to frames
    frames.append(df)

# Concatenate frames into a single DataFrame: uber
uber = pd.concat(frames)

# Print the shape of uber
print(uber.shape)

# Print the head of uber
print(uber.head())
Merge data
pd.merge()直接将两个数据表连接
1-to-1 data merge
您的任务是使用的'name'列和'site'列对这两个site,visited两个DataFrame执行1对1合并。
# Merge the DataFrames: o2o
o2o = pd.merge(left=site, right=visited, left_on='name', right_on='site')

# Print o2o
print(o2o)
Many-to-many data merge(多对多数据合并)
# Merge survey, visited and site to a single data frame
# of surveys with visit and site details
m2m = pd.merge(survey,visited,left_on='taken',right_on='ident')
m2m = pd.merge(m2m,site,left_on='site',right_on='name')
print(m2m)
Data types
练习行列.astype()、.info()
# Convert the sex column to type 'category'
tips.sex = tips.sex.astype('category')

# Convert the smoker column to type 'category'
tips.smoker = tips.smoker.astype('category')

# Print the info of tips
print(tips.info())
Working with numeric data(处理数字数据)
pd.to_numeric()
NaN通过指定关键字arguments 将错误强制为errors='coerce'。
# Convert 'total_bill' to a numeric dtype
tips['total_bill'] = pd.to_numeric(tips['total_bill'], errors='coerce')

# Convert 'tip' to a numeric dtype
tips['tip'] = pd.to_numeric(tips['tip'], errors='coerce')

# Print the info of tips
print(tips.info())
Using regular expressions to clean strings(使用正则表达式清除字符串)
正则表达式规则
匹配XXX-XXX-XXXX
# Import the regular expression module
import re

# Compile the pattern: prog
prog = re.compile('^\d{3}-\d{3}-\d{4}$')

# See if the pattern matches
result = prog.match('123-456-7890')
print(bool(result))

# See if the pattern matches
result2 = prog.match('1123-456-7890')
print(bool(result2))
匹配文本中的字符串'\d+',返回数字列表
# Import the regular expression module
import re

# Find the numeric values: matches
matches = re.findall('\d+', 'the recipe calls for 10 strawberries and 1 banana')

# Print the matches
print(matches)
匹配练习
# Write the first pattern
pattern1 = bool(re.match(pattern='\d{3}-\d{3}-\d{4}', string='123-456-7890'))
print(pattern1)

# Write the second pattern
pattern2 = bool(re.match(pattern='\$\d*\.\d{2}', string='$123.45'))
print(pattern2)

# Write the third pattern
pattern3 = bool(re.match(pattern='\w*[A-Z]', string='Australia'))
print(pattern3)
Using functions to clean data(自定义功能以清理数据)
df.apply(np.mean, axis=0)
# Define recode_gender()
def recode_gender(gender):

    # Return 0 if gender is 'Female'
    if  gender == 'Female':
        return 0

    # Return 1 if gender is 'Male'
    elif gender == 'Male':
        return 1

    # Return np.nan
    else:
        return np.nan

# Apply the function to the sex column
tips['recode'] = tips.sex.apply(recode_gender)

# Print the first five rows of tips
print(tips.head())
df.apply(lambda x: x ** 2)使用lambda函数清除美元符号,分别用.replace() 和.findall()方法结合匿名函数实现
# Write the lambda function using replace
tips['total_dollar_replace'] = tips.total_dollar.apply(lambda x: x.replace('$', ''))

# Write the lambda function using regular expressions
tips['total_dollar_re'] = tips.total_dollar.apply(lambda x:re.findall('\d+\.\d+', x)[0])

# Print the head of tips
print(tips.head())
Duplicate and missing data
.drop_duplicates()方法删除重复的行
# Create the new DataFrame: tracks
tracks = billboard[['year','artist','track','time']]

# Print info of tracks
print(tracks.info())

# Drop the duplicates: tracks_no_duplicates
tracks_no_duplicates = tracks.drop_duplicates()

# Print info of tracks
print(tracks_no_duplicates.info())
.fillna()覆盖缺失值
# Calculate the mean of the Ozone column: oz_mean
oz_mean = airquality.Ozone.mean()

# Replace all the missing values in the Ozone column with the mean
airquality['Ozone'] = airquality.Ozone.fillna(oz_mean)

# Print the info of airquality
print(airquality.info())
Testing with asserts(使用断言进行测试)
.all().all()
编写一个assert语句以确认
ebola中没有缺失值。
- 使用
pd.notnull()函数onebola(或.notnull()方法)和链接两个.all()方法(即.all().all())。第一个.all()方法将为每列返回一个True或False,而第二种.all()方法将返回一个True或False。
# Assert that there are no missing values
assert pd.notnull(ebola).all().all()

# Assert that all values are >= 0
assert (ebola >= 0).all().all()
Putting it all together
.value_counts()
Thinking about the question at hand
案例分析
由于按国家和年份提供了预期寿命水平数据,因此您可以提出有关平均预期寿命每年变化多少的问题。
但是,在继续之前,重要的是要确保以下有关数据的假设是正确的:
'Life expectancy'是DataFrame 的第一列(索引)。- 其他列包含空值或数字值。
- 数值均大于或等于0。
- 每个国家只有一个实例。
您可以编写一个可以应用于整个DataFrame的函数,以验证其中的一些假设。请注意,花时间编写此类脚本也可以在处理其他数据集时为您提供帮助。
def check_null_or_valid(row_data):
    """Function that takes a row of data,
    drops all missing values,
    and checks if all remaining values are greater than or equal to 0
    """
    no_na = row_data.dropna()
    numeric = pd.to_numeric(no_na)
    ge0 = numeric >= 0
    return ge0

# Check whether the first column is 'Life expectancy'
assert g1800s.columns[0] == 'Life expectancy'

# Check whether the values in the row are valid
assert g1800s.iloc[:, 1:].apply(check_null_or_valid, axis=1).all().all()

# Check that there is only one instance of each country
assert g1800s['Life expectancy'].value_counts()[0] == 1
Assembling your data (汇总你的数据)
在这里,三个DataFrames已预先加载:
g1800s,g1900s,和g2000s。这些分别包含19世纪,20世纪和21世纪的Gapminder预期寿命数据。汇总三个世纪的寿命数据。
axis轴用来为超过一维的数组定义的属性,二维数据拥有两个轴:第0轴沿着行的垂直往下,第1轴沿着列的方向水平延伸
# Concatenate the DataFrames column-wise
gapminder = pd.concat([g1800s, g1900s, g2000s],axis=1)

# Print the shape of gapminder
print(gapminder.shape)

# Print the head of gapminder
print(gapminder.head())
Initial impressions of the data
Reshaping your data
import pandas as pd

# Melt gapminder: gapminder_melt
gapminder_melt = pd.melt(gapminder,id_vars='Life expectancy')

# Rename the columns
gapminder_melt.columns = ['country', 'year','life_expectancy']

# Print the head of gapminder_melt
print(gapminder_melt.head())
Checking the data types
# Convert the year column to numeric
gapminder.year = pd.to_numeric(gapminder['year'],errors='coerce')

# Test if country is of type object
assert gapminder.country.dtypes == np.object

# Test if year is of type int64
assert gapminder.year.dtypes == np.int64

# Test if life_expectancy is of type float64
assert gapminder.life_expectancy.dtypes == np.float64
Pandas具有内置的字符串方法-- str.contains()采用正则表达式模式,并将其应用于Series,True如果匹配则返回 ,False否则返回。
Looking at country spellings
数据清理过程中的下一个任务是查看该
'country'列,以查看是否需要处理任何特殊或无效字符。合理地假设国名将包含:
- 小写和大写字母的集合。
- 单词之间的空格。
- 任何缩写的句号。
# Create the series of countries: countries
countries = gapminder['country']

# Drop all the duplicates from countries
countries = countries.drop_duplicates()

# Write the regular expression: pattern
pattern = '^[A-Za-z .]*$'

# Create the Boolean vector: mask
mask = countries.str.contains(pattern)

# Invert the mask: mask_inverse
mask_inverse = ~mask

# Subset countries using mask_inverse: invalid_countries
invalid_countries = countries[mask_inverse]

# Print invalid_countries
print(invalid_countries)
More data cleaning and processing
在本练习中,您将练习删除缺失的值。你的任务是放弃所有具有行
NaN的life_expectancy列。在这样做之前,使用assert语句确认该值year并且country不丢失任何值将是有价值的。
.dropna()
# Assert that country does not contain any missing values
assert pd.notnull(gapminder.country).all()

# Assert that year does not contain any missing values
assert pd.notnull(gapminder.year).all()

# Drop the missing values
gapminder = gapminder.dropna(axis=0,how='any')

# Print the shape of gapminder
print(gapminder.shape)
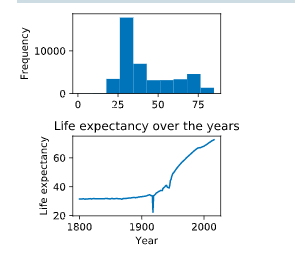
Wrapping up
# Add first subplot
plt.subplot(2, 1, 1)

# Create a histogram of life_expectancy
gapminder.life_expectancy.plot(kind='hist')

# Group gapminder: gapminder_agg
gapminder_agg = gapminder.groupby('year')['life_expectancy'].mean()

# Print the head of gapminder_agg
print(gapminder_agg.head())

# Print the tail of gapminder_agg
print(gapminder_agg.tail())

# Add second subplot
plt.subplot(2, 1, 2)

# Create a line plot of life expectancy per year
gapminder_agg.plot()

# Add title and specify axis labels
plt.title('Life expectancy over the years')
plt.ylabel('Life expectancy')
plt.xlabel('Year')

# Display the plots
plt.tight_layout()
plt.show()

# Save both DataFrames to csv files
gapminder.to_csv('gapminder.csv')
gapminder_agg.to_csv('gapminder_agg.csv')


 605
605

 被折叠的 条评论
为什么被折叠?
被折叠的 条评论
为什么被折叠?
 到【灌水乐园】发言


