


 本文详细介绍了Seaborn与matplotlib的区别,展示了Seaborn如何轻松绘制散点图、直方图、密度图、柱状图和热力图。Seaborn的强大之处在于其丰富的图形效果设置,包括主题调整、调色功能,使得数据可视化更加直观和美观。
概述
Seaborn是matplotlib的强大的一个扩展。
Seaborn和matplotlib对比
数据准备
首先导入数据,数据事先准备好的是一些花的品种,其他列分别表示花萼的长度\宽度、花瓣的长度\宽度
花的品种一共三种:

需求
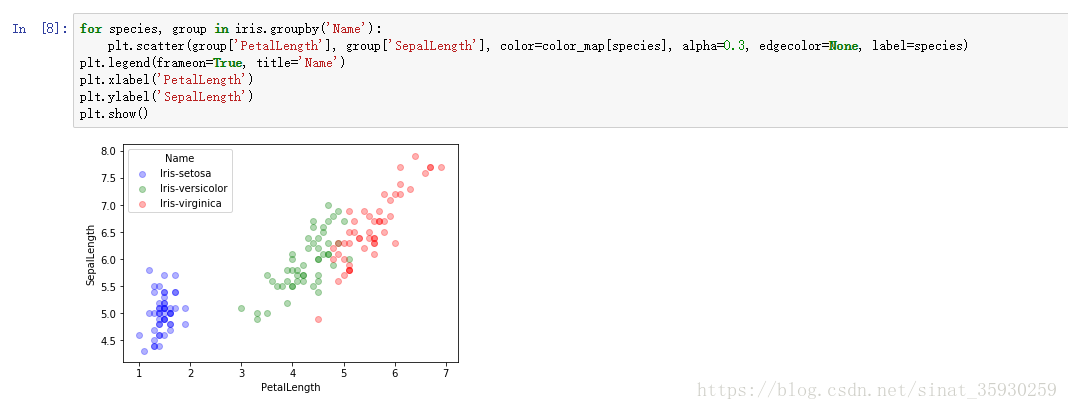
要求画出花萼和花瓣的长度的散点图,并且颜色要区分花的种类
实施
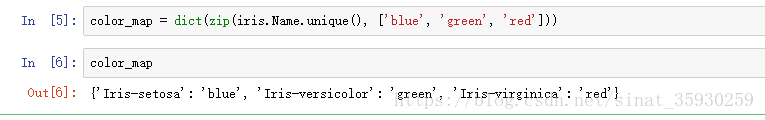
首先根据花的种类定义好每种类花的颜色:
使用matplotlib画图
使用seaborn画图
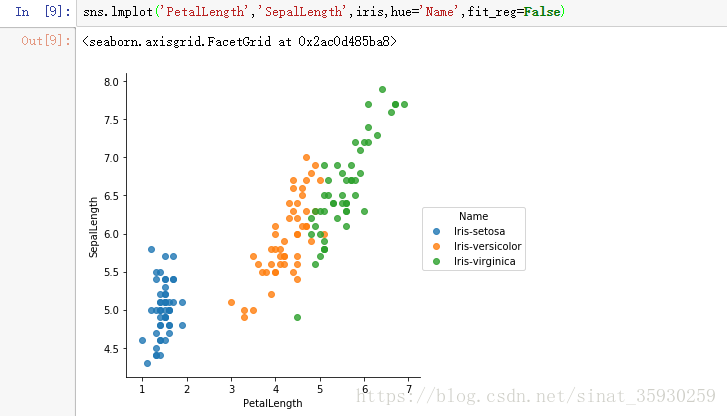
seaborn比matplotlib画散点图简单的多,只需要一行代码就搞定。
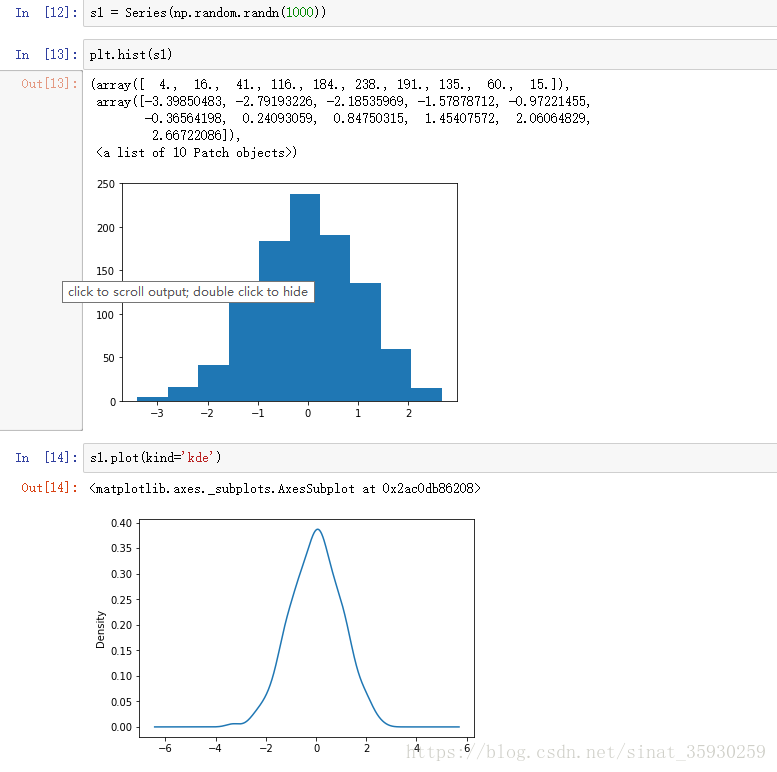
seaborn实现直方图和密度图
回顾matplotlib绘制直方图和密度图的方法
用seaborn distplot绘制
seaborn有一个强大的方法:distplot,它支持一些参数:
bins:直方图的分块
hist:True表示绘制直方图,默认为True
kde:True表示绘制密度图,默认为True
rug:显示分布情况,默认为False不显示
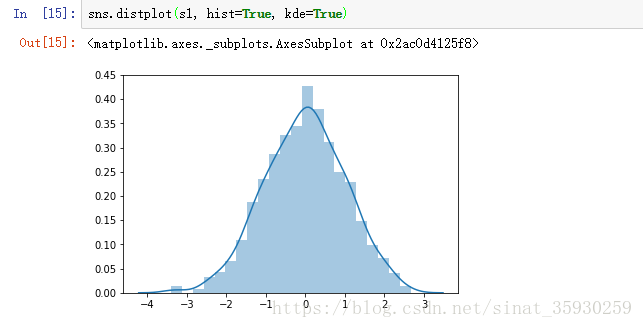
可以看到,seaborn同时画出了直方图和密度图。
 最低0.47元/天 解锁文章


 2万+
2万+

 被折叠的 条评论
为什么被折叠?
被折叠的 条评论
为什么被折叠?
 到【灌水乐园】发言


