


 本文深入探讨TeeChart Pro .NET的高级轴处理,包括如何创建附加轴、自定义轴的位置与滚动行为,以及如何利用轴事件实现动态标签交互。示例代码展示了如何在图表中心添加水平和垂直轴,并通过轴事件增强用户交互体验。
本文接着上一篇未讲完的《文章TeeChart Pro .NET使用教程(2022):如何处理高级轴和图例操作》继续为大家带来下半部分。
附加轴
TeeChart 提供 5 个与数据系列相关联的轴:左、上、下、右和深度。 当您将新系列添加到图表时,您可以定义系列应该与哪个轴相关(转到系列选项卡,常规页面)。 您可以使用 Axis Customdraw 方法在图表上的任何位置重复前面 4 个轴中的任何一个(或全部)。 请注意,此方法会复制您的轴,它不会添加新的自定义轴。 例子:
[C#.Net]
private void Form1_Load(object sender, System.EventArgs e)

            Random Rnd = new Random();
            tChart1.Aspect.View3D = false;
            tChart1.Panel.Gradient.Visible = true;
            for(int t = 0; t <= 20; ++t)
            line1.Add(t, ((Rnd.Next(100)) + 1) - ((Rnd.Next(70)) + 1), Color.Red);


private void line1_BeforeDrawValues(object sender, Steema.TeeChart.Drawing.Graphics3D g)

            int posAxis = 0;
            if(tChart1.Axes.Left.Maximum > 0)

                tChart1.Axes.Left.Draw(g.ChartXCenter - 10,g.ChartXCenter - 20,g.ChartXCenter,true);
                posAxis = tChart1.Axes.Left.CalcYPosValue(10);
                tChart1.Axes.Bottom.Draw(posAxis + 10, posAxis + 40, posAxis, true);


[VB.Net]
Private Sub Form1_Load(ByVal sender As System.Object, ByVal e As System.EventArgs) Handles MyBase.Load
        Dim t As Integer
        TChart1.Aspect.View3D = False
        TChart1.Panel.Gradient.Visible = True
        For t = 0 To 20
            Line1.Add(t, ((Rnd() * 100) + 1) - ((Rnd() * 70) + 1), Color.Red)
        Next
    End Sub

Private Sub Line1_BeforeDrawValues(ByVal sender As Object, ByVal g As Steema.TeeChart.Drawing.Graphics3D) Handles Line1.BeforeDrawValues
        Dim posAxis As Integer
        If TChart1.Axes.Left.Maximum > 0 Then
            TChart1.Axes.Left.Draw(g.ChartXCenter - 10, g.ChartXCenter - 20, g.ChartXCenter, True)
            posAxis = TChart1.Axes.Left.CalcYPosValue(10)
            TChart1.Axes.Bottom.Draw(posAxis + 10, posAxis + 40, posAxis, True)
        End If
End Sub
上面的示例代码将生成下图:
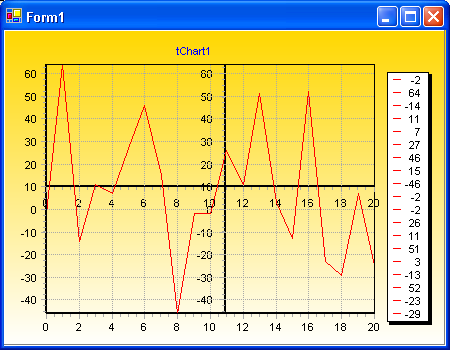
在此示例中,TeeChart 将在图表中心绘制新轴,一个水平轴和一个垂直轴。 当您滚动图表(用鼠标右键拖动)时,新的垂直轴将始终保持在图表的中心,新的水平轴将随着垂直滚动上下移动。 新轴是默认轴的精确副本。
与 PositionPercent 和拉伸属性一起,可以在图表上的任何位置浮动无限的轴。 滚动、缩放和轴命中检测也适用于自定义创建的轴。 现在可以在设计时通过 TeeChart 编辑器和在运行时通过几行代码创建额外的轴:
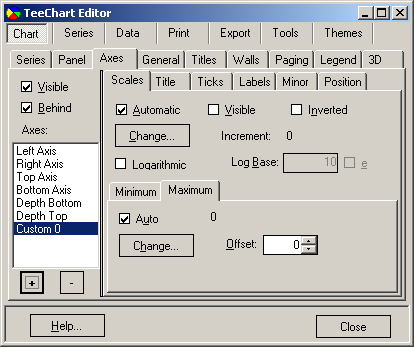
TeeChart 使您能够在设计时创建自定义轴,从而使它们能够以 TeeChart 的 tee 文件格式保存。 为此,打开图表编辑器并单击轴选项卡,然后选择“+”按钮添加自定义轴。 然后选择位置选项卡,确保突出显示新的自定义轴。 此页面上的水平复选框允许您将新的自定义轴定义为水平轴或将其保留为默认垂直轴。 此页面的其余部分和轴页面中的其他选项卡可用于更改自定义轴的刻度、增量、标题、标签、刻度、次刻度和位置,如上所述。 要将这个新的自定义轴与您想要的数据系列相关联,请选择“系列”选项卡并转到“常规”页面,其中下拉组合框“水平轴”和“垂直轴”将使您能够根据您之前是否定义选择新的自定义轴 它是垂直的或水平的。
Via Code
[C#.Net]
private void Form1_Load(object sender, System.EventArgs e)

            Line line1 = new Line();
            Line line2 = new Line();

            tChart1.Aspect.View3D = false;
            tChart1.Panel.Gradient.Visible = true;
            tChart1.Header.Text = "TeeChart Multiple Axes";
            tChart1.Series.Add(line1);
            tChart1.Series.Add(line2);

            for(int t = 0; t <= 10; ++t)

                line1.Add(Convert.ToDouble(t), Convert.ToDouble(10 + t), Color.Red);
                if(t > 1)
                line2.Add(Convert.ToDouble(t), Convert.ToDouble(t), Color.Green);


            Axis leftAxis = tChart1.Axes.Left;

            leftAxis.StartPosition = 0;
            leftAxis.EndPosition = 50;
            leftAxis.AxisPen.Color = Color.Red;
            leftAxis.Title.Font.Color = Color.Red;
            leftAxis.Title.Font.Bold = true;
            leftAxis.Title.Text = "1st Left Axis";

//            You are able to then position the new Axis in overall relation to the Chart
//            by using the StartPosition and EndPosition  properties.
//
//            StartPosition=50
//            EndPosition=100
//
//            These figures are expressed as percentages of the Chart Rectangle with 0 (zero)
//            (in the case of a vertical Axis) being Top. These properties can be applied to
//            the Standard Axes to create completely partitioned 'SubCharts' within the Chart.

            Axis axis1 = new Axis(false, false, tChart1.Chart);

            tChart1.Axes.Custom.Add(axis1);

            line2.CustomVertAxis = axis1;

            axis1.StartPosition = 50;
            axis1.EndPosition = 100;
            axis1.AxisPen.Color = Color.Green;
            axis1.Title.Font.Color = Color.Green;
            axis1.Title.Font.Bold = true;
            axis1.Title.Text = "Extra Axis";
            axis1.PositionUnits= PositionUnits.Percent;
                                                axis1.RelativePosition = 20;


[VB.Net]
Private Sub Form1_Load(ByVal sender As System.Object, ByVal e As System.EventArgs) Handles MyBase.Load
        Dim Line1 As New Steema.TeeChart.Styles.Line()
        Dim Line2 As New Steema.TeeChart.Styles.Line()
        Dim t As Integer

        TChart1.Aspect.View3D = False
        TChart1.Panel.Gradient.Visible = True
        TChart1.Header.Text = "TeeChart Multiple Axes"
        TChart1.Series.Add(Line1)
        TChart1.Series.Add(Line2)

        For t = 0 To 10
            Line1.Add(t, 10 + t, Color.Red)
            If (t > 1) Then
                Line2.Add(t, t, Color.Green)
            End If
        Next

        With TChart1.Axes.Left
            .StartPosition = 0
            .EndPosition = 50
            .AxisPen.Color = Color.Red
            .Title.Font.Color = Color.Red
            .Title.Font.Bold = True
            .Title.Text = "1st Left Axis"
        End With

        'You are able to then position the new Axis in overall relation to the Chart
        'by using the StartPosition and EndPosition  properties.

        '      StartPosition = 50
        '      EndPosition = 100

        'These figures are expressed as percentages of the Chart Rectangle with 0 (zero)
        '(in the case of a vertical Axis) being Top. These properties can be applied to
        'the Standard Axes to create completely partitioned 'SubCharts' within the Chart.

        Dim Axis1 As New Steema.TeeChart.Axis(False, False, TChart1.Chart)

        TChart1.Axes.Custom.Add(Axis1)

        Line2.CustomVertAxis = Axis1

        Axis1.StartPosition = 50
        Axis1.EndPosition = 100
        Axis1.AxisPen.Color = Color.Green
        Axis1.Title.Font.Color = Color.Green
        Axis1.Title.Font.Bold = True
        Axis1.Title.Text = "Extra Axis"
        Axis1.PositionUnits.=  PositionUnits.Percent;
        Axis1.RelativePosition = 20
End Sub
上面的编码示例将显示以下图表:
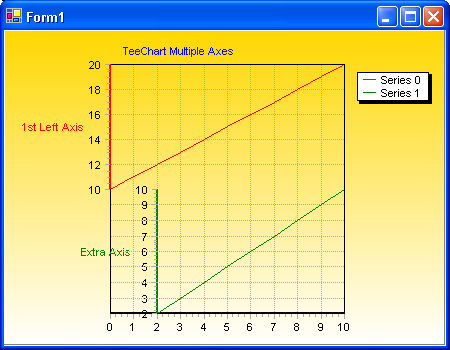
选择是无限的! 我们建议在使用自定义轴时要小心,因为很容易开始用新轴填充屏幕并忘记要管理哪个轴!
轴事件提供运行时灵活性来修改轴标签并在轴点击上呈现用户交互性。
接下来举一个 OnClickAxis 事件的例子。
[C#.Net]
private void tChart1_ClickAxis(object sender, System.Windows.Forms.MouseEventArgs e)

            if(((Steema.TeeChart.Axis)sender).Equals(tChart1.Axes.Bottom))

                MessageBox.Show("Clicked Bottom Axis at: " + line1.XScreenToValue(e.X));


[VB.Net]
Private Sub TChart1_ClickAxis(ByVal sender As Object, ByVal e As System.Windows.Forms.MouseEventArgs) Handles TChart1.ClickAxis
        If CType(sender, Steema.TeeChart.Axis) Is TChart1.Axes.Bottom Then
            MsgBox("Clicked Bottom Axis at: " & Line1.XScreenToValue(e.X))
        End If
End Sub
可用于修改轴标签。接下来来看一个OnGetAxisLabel 事件的例子。
[C#.Net]
private void button1_Click(object sender, System.EventArgs e)

            bar1.FillSampleValues(20);
            tChart1.Axes.Bottom.Labels.Style = AxisLabelStyle.Mark;


private void tChart1_GetAxisLabel(object sender, Steema.TeeChart.TChart.GetAxisLabelEventArgs e)

            if(((Steema.TeeChart.Axis)sender).Equals(tChart1.Axes.Bottom))
            e.LabelText = "Period " + Convert.ToString(e.ValueIndex);


[VB.Net]
Private Sub Button1_Click(ByVal sender As Object, ByVal e As System.EventArgs) Handles Button1.Click
        Bar1.FillSampleValues(20)
        TChart1.Axes.Bottom.Labels.Style = Steema.TeeChart.AxisLabelStyle.Mark
End Sub

Private Sub TChart1_GetAxisLabel(ByVal sender As Object, ByVal e As Steema.TeeChart.TChart.GetAxisLabelEventArgs) Handles TChart1.GetAxisLabel
        If CType(sender, Steema.TeeChart.Axis) Is TChart1.Axes.Bottom Then
            e.LabelText = "Period " & e.ValueIndex
        End If
End Sub
可用于决定应显示哪些轴标签。下面是一个OnGetNextAxisLabel事件例子,您应该使用 e.Stop Boolean属性来包含/排除轴标签。
[C#.Net]
private void Form1_Load(object sender, System.EventArgs e)

            line1.FillSampleValues(20);


private void tChart1_GetNextAxisLabel(object sender, Steema.TeeChart.TChart.GetNextAxisLabelEventArgs e)

            if(((Steema.TeeChart.Axis)sender).Equals(tChart1.Axes.Bottom))

                e.Stop = false;
                switch(e.LabelIndex)

                    case 0: e.LabelValue = 5; break;
                    case 1: e.LabelValue = 13; break;
                    case 2: e.LabelValue = 19; break;
                    default: e.Stop = true; break;


[VB.Net]
Private Sub Form1_Load(ByVal sender As System.Object, ByVal e As System.EventArgs) Handles MyBase.Load
        Line1.FillSampleValues(20)
End Sub

Private Sub TChart1_GetNextAxisLabel(ByVal sender As Object, ByVal e As Steema.TeeChart.TChart.GetNextAxisLabelEventArgs) Handles TChart1.GetNextAxisLabel
        If CType(sender, Steema.TeeChart.Axis) Is TChart1.Axes.Bottom Then
            e.Stop = False
            Select Case e.LabelIndex
                Case 0 : e.LabelValue = 5
                Case 1 : e.LabelValue = 13
                Case 2 : e.LabelValue = 19
                Case Else : e.Stop = True
            End Select
        End If
End Sub


 3967
3967

 被折叠的 条评论
为什么被折叠?
被折叠的 条评论
为什么被折叠?
 到【灌水乐园】发言


