


 本文详细介绍了TeeChartPro图表组件如何自动定义和自定义轴标签,包括多轴支持、轴刻度范围、增量、日期时间格式、轴位置、标签样式和对数刻度等。此外,还展示了在设计时和运行时如何通过代码控制轴属性,如改变轴的最大值、最小值、间隔、标签频率和格式。
TeeChart Pro 将自动为您定义所有 Axis 标签,并提供足够的灵活性来定制您可能有的任何特定要求。 TeeChart Pro 提供真正的多轴。 这些在设计或运行时可用,并为 Axis 定义提供了无数的可能性和灵活性。
轴控制-关键区域
将系列数据添加到图表时会自动设置轴刻度。 您可以在设计时或运行时使用 Axis 属性更改默认值。
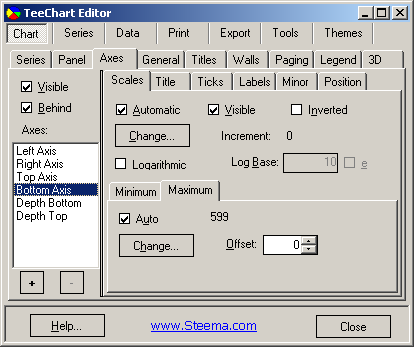
添加新系列时,TeeChart 编辑器的轴页面的比例部分将显示选择自动,其他选项显示为灰色。 显示的所有值都是数字。
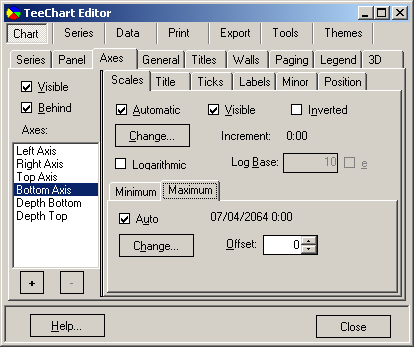
当系列在系列 -> 常规页面上将日期时间设置为 true(对于该轴)时,TeeChart 编辑器的轴页面的比例部分将显示选择自动,其他选项灰显。 值与日期时间值一起显示。
自动选择最佳轴刻度范围以适合您的数据。 如果您关闭“自动”,比例部分将变为灰色选项,您可以更改轴值。 重要的是,请记住从页面左侧的轴列表中选择要配置的轴。
在设计时使用 TeeChart 编辑器将线系列添加到图表,然后使用以下代码添加命令按钮:
[C#.Net]
Random rnd = new Random();
for(int i = 0; i <= 40; ++i)
line1.Add(Convert.ToDouble(i),rnd.Next(100),Color.Red);

[VB.Net]
Dim i As Integer
For i = 0 To 40
   Line1.Add(Convert.ToDouble(i), Rnd() * 100, Color.Red)
Next i
运行按钮中的代码将绘制一个具有 40 个随机值的 Line Series。 在设计时转到 TeeChart 编辑器。 在 Axis 页面的 Bottom Axis scales 部分中关闭 Automatic 'off'。 您现在可以配置轴刻度的最大值和最小值。 再次运行代码将根据您为轴配置的值显示值。 使用鼠标右键,您可以滚动查看剩余值。
您可以使用以下代码在运行时更改最大值和最小值:
[C#.Net]
Steema.TeeChart.Axis bottomAxis = tChart1.Axes.Bottom;
bottomAxis.Automatic = false;
bottomAxis.Maximum = 36;
bottomAxis.Minimum = 5;

[VB.Net]
With TChart1.Axes.Bottom
   .Automatic = False
   .Maximum = 36
   .Minimum = 5
End With
您可以将轴刻度最大值和最小值分别设置为自动。 例如:
[C#.Net]
Steema.TeeChart.Axis bottomAxis = tChart1.Axes.Bottom;
bottomAxis.AutomaticMaximum = true;
bottomAxis.AutomaticMinimum = false;
bottomAxis.Minimum = 5;

[VB.Net]
With TChart1.Axes.Bottom
   .AutomaticMaximum = True
   .AutomaticMinimum = False
   .Minimum = 5
End With
您可以定制轴的间隔。 从 Axis 页面的 Scales 部分选择 Desired Increment 组合框并添加您需要的增量。 您可以在运行时通过代码更改它:
[C#.Net]
Steema.TeeChart.Axis bottomAxis = tChart1.Axes.Bottom;
bottomAxis.Increment = 20;

[VB.Net]
With TChart1.Axes.Bottom
   .Increment = 20
End With
如果您的数据是日期时间(您可以通过转到系列,常规页面将数据设置为您的系列的日期时间),图表->轴页面,比例部分将显示日期时间范围。 从 Desired Increment 组合框中显示的范围中选择增量并添加一些示例数据:
[C#.Net]
Random rnd = new Random();
DateTime today = DateTime.Today;
TimeSpan oneDay = TimeSpan.FromDays(1);
line1.XValues.DateTime = true;
for(int i = 1; i <= 25; ++i)
     line1.Add(today,rnd.Next(100),Color.Red);
     today += oneDay;


[VB.Net]
Dim i As Integer
Dim Today As DateTime = DateTime.Today
Dim OneDay As TimeSpan = TimeSpan.FromDays(1)
Line1.XValues.DateTime = True
For i = 1 To 25
     Line1.Add(Today, Rnd() * 100, Color.Red)
     Today = Today.Add(OneDay)
Next
在运行时更改增量:
[C#.Net]
Steema.TeeChart.Axis bottomAxis = tChart1.Axes.Bottom;
bottomAxis.Increment = Steema.TeeChart.Utils.GetDateTimeStep(Steema.TeeChart.DateTimeSteps.TwoDays);

[VB.Net]
With TChart1.Axes.Bottom
   .Increment = Steema.TeeChart.Utils.GetDateTimeStep(Steema.TeeChart.DateTimeSteps.TwoDays)
End With
更改轴标签频率时,请记住 TeeChart 将根据 AxisLabels.Separation 属性的设置避免标签重叠。 这意味着如果标签频率太高而无法适应标签,则 TeeChart 将分配“最佳匹配”。 更改标签角度和标签分隔是 2 个选项,可以帮助您适应所需的标签。
标题在 Axis 页面的 Titles 部分中设置。 您可以更改轴的标题文本及其字体和阴影属性。 也可以指定标题文本的角度和大小。
您可以将所有标准数字和日期格式应用于轴标签。 轴页面,标签部分包含“值格式”字段。 如果您的数据是日期时间,则字段名称将更改为“日期时间格式”。 在运行时使用:
[C#.Net]
tChart1.Axes.Bottom.Labels.ValueFormat = "#,##0.00;(#,##0.00)";

[VB.Net]
With TChart1.Axes.Bottom
   .Labels.ValueFormat = "#,##0.00;(#,##0.00)"
End With
或日期时间数据
[C#.Net]
tChart1.Axes.Bottom.Labels.DateTimeFormat = "dddd/MMMM/yyyy";

[VB.Net]
With TChart1.Axes.Bottom
   .Labels.DateTimeFormat = "dddd/MMMM/yyyy"
End With

MultiLine labels
轴标签可以显示为多行文本,而不是单行文本。 使用 LineSeparator 字符 () 分隔行。例如:
[C#.Net]
bar1.Add(1234, "New" + Steema.TeeChart.Texts.LineSeparator + "Cars", Color.Red);
bar1.Add(2000, "Old" + Steema.TeeChart.Texts.LineSeparator + "Bicycles", Color.Red);
tChart1.Panel.MarginBottom = 10;

[VB.Net]
Bar1.Add(1234, "New" + Steema.TeeChart.Texts.LineSeparator + "Cars", Color.Red)
Bar1.Add(2000, "Old" + Steema.TeeChart.Texts.LineSeparator + "Bicycles", Color.Red)
TChart1.Panel.MarginBottom = 10
DateTime 标签的示例: 下面将在两行文本中显示底部轴标签,一行显示月份和日期,第二行显示年份:
2 月 28 日 Mar-1 ..
2003 2003 ..
[C#.Net]
bar1.Add(DateTime.Parse("28/2/2003"), 100, Color.Red);
bar1.Add(DateTime.Parse("1/3/2003"), 200, Color.Red);
bar1.Add(DateTime.Parse("2/3/2003"), 150, Color.Red);
bar1.XValues.DateTime = true;
tChart1.Axes.Bottom.Labels.DateTimeFormat = "MM/dd hh:mm";
tChart1.Axes.Bottom.Labels.MultiLine = true;
tChart1.Panel.MarginBottom = 10;

[VB.Net]
Bar1.Add(DateValue("28/2/2003"), 100, Color.Red)
Bar1.Add(DateValue("1/3/2003"), 200, Color.Red)
Bar1.Add(DateValue("2/3/2003"), 150, Color.Red)
Bar1.XValues.DateTime = True
TChart1.Axes.Bottom.Labels.DateTimeFormat = "MM/dd hh:mm"
TChart1.Axes.Bottom.Labels.MultiLine = True
TChart1.Panel.MarginBottom = 10
将 AxisLabels.MultiLine 属性设置为 True 将自动将标签拆分为有空格的行,从而有效地将标签分为两部分: 'mm/dd' 代表第一行; 'hh:mm' 第二行。
在运行时,您始终可以使用 OnGetAxisLabel 事件以编程方式将标签拆分为行:
[C#.Net]
private void tChart1_GetAxisLabel(object sender, Steema.TeeChart.TChart.GetAxisLabelEventArgs e)

            string myLabelText = e.LabelText;
            tChart1.Axes.Bottom.Labels.SplitInLines(ref myLabelText, " ");
            e.LabelText = myLabelText;


[VB.Net]
Private Sub TChart1_GetAxisLabel(ByVal sender As Object, ByVal e As Steema.TeeChart.TChart.GetAxisLabelEventArgs) Handles TChart1.GetAxisLabel
        Dim myLabelText As String
        myLabelText = e.LabelText
        TChart1.Axes.Bottom.Labels.SplitInLines(myLabelText, " ")
        e.LabelText = myLabelText
End Sub
在上面的示例中,全局“TeeSplitInLines”过程将“LabelText”中的所有空格转换为行分隔符(返回)。
轴 AxisLabels.Angle 属性也可以与多线轴标签一起使用。
进一步的标签控制可以通过使用 Axis 事件来获得。 这些事件允许您激活/停用/更改任何单个轴标签。 以下示例修改每个标签,在点索引值前面放置一个文本短语:
[C#.Net]
private void button1_Click(object sender, System.EventArgs e)

            bar1.FillSampleValues(20);
            tChart1.Axes.Bottom.Labels.Style = AxisLabelStyle.Mark;


private void tChart1_GetAxisLabel(object sender, Steema.TeeChart.TChart.GetAxisLabelEventArgs e)

            if(((Steema.TeeChart.Axis)sender).Equals(tChart1.Axes.Bottom))
            e.LabelText = "Period " + Convert.ToString(e.ValueIndex);


[VB.Net]
Private Sub Button1_Click(ByVal sender As Object, ByVal e As System.EventArgs) Handles Button1.Click
        Bar1.FillSampleValues(20)
        TChart1.Axes.Bottom.Labels.Style = Steema.TeeChart.AxisLabelStyle.Mark
End Sub

Private Sub TChart1_GetAxisLabel(ByVal sender As Object, ByVal e As Steema.TeeChart.TChart.GetAxisLabelEventArgs) Handles TChart1.GetAxisLabel
        If CType(sender, Steema.TeeChart.Axis) Is TChart1.Axes.Bottom Then
            e.LabelText = "Period " & e.ValueIndex
        End If
End Sub
正态对数标记可以通过以下方式设置:
[C#.Net]
private void button1_Click(object sender, System.EventArgs e)

            Random rnd = new Random();
            Steema.TeeChart.Axis leftAxis = tChart1.Axes.Left;
            tChart1.Aspect.View3D = false;
            bar1.Marks.Visible = false;
            for(int i = 0; i <= 100; ++i)
            bar1.Add(rnd.Next(100) * i);
            leftAxis.LogarithmicBase = 10;
            leftAxis.Logarithmic = true;
            leftAxis.SetMinMax(0, 10000);
            leftAxis.Labels.ValueFormat = "#e+0"; //exponential format


[VB.Net]
Private Sub Button1_Click(ByVal sender As Object, ByVal e As System.EventArgs) Handles Button1.Click
        Dim i As Integer
        TChart1.Aspect.View3D = False
        Bar1.Marks.Visible = False
        For i = 0 To 10000 Step 100
            Bar1.Add(Rnd() * i)
        Next
        With TChart1.Axes.Left
            .LogarithmicBase = 10
            .Logarithmic = True
            .SetMinMax(0, 10000)
            .Labels.ValueFormat = "#e+0" ' exponential format
        End With
End Sub
标签将根据对数基数(默认为 10)设置,因此在这种情况下,标签为 1、10、100、1000、10000。
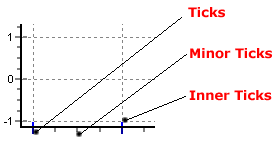
有 3 种刻度类型和 2 种网格类型。 您可以更改每个刻度和网格类型的长度、宽度和颜色。 可以通过“Ticks”选项卡对 Ticks、它们关联的 Grid 和 Inner Ticks 进行更改; 可以通过“次要”选项卡对次要刻度及其相关网格进行更改。 TeeChart Pro 版本 5 的新增功能是能够更改宽度大于 1(默认)的刻度和网格的样式。
[C#.Net]
Steema.TeeChart.Axis bottomAxis = tChart1.Axes.Bottom;
bottomAxis.Ticks.Length = 7;
bottomAxis.Ticks.Color = Color.Green;
bottomAxis.MinorTickCount = 10;

[VB.Net]
With TChart1.Axes.Bottom
   .Ticks.Length = 7
   .Ticks.Color = Color.Green
   .MinorTickCount = 10
End With
轴具有修改每个轴的位置的属性。 在此示例中,轴移动了图表总宽度的 50%,因此它显示在图表中心:
[C#.Net]
Steema.TeeChart.Axis bottomAxis = tChart1.Axes.Bottom;
bottomAxis.PositionUnits = PositionUnits.Percent;
bottomAxis. RelativePosition = 50

[VB.Net]
With TChart1.Axes.Bottom
   .PositionUnits = PositionUnits.Percent
   .RelativePosition = 50
End With 


:如何处理高级轴和图例操作(上)&spm=1001.2101.3001.5002&articleId=124021710&d=1&t=3&u=ec2f8ff2f470441eab441e93263f1bf8)
 1875
1875

 被折叠的 条评论
为什么被折叠?
被折叠的 条评论
为什么被折叠?
 到【灌水乐园】发言


