


 本文档详细介绍了如何安装Prometheus和Grafana。首先通过wget下载并解压Prometheus,然后编辑prometheus.yml文件添加job,并将Prometheus设为systemd服务。接着,文章说明了Prometheus默认监听的9090端口可用性。其次,按照官方文档安装Grafana,并确保开放3000端口以允许访问,通过iptables设置防火墙规则。最后,强调了初次登录Grafana时需使用admin账号和初始密码admin,并在首次登录后更改密码。
(一) 安装prometheus install
$ wget https://github.com/prometheus/prometheus/releases/download/v2.4.3/prometheus-2.4.3.linux-amd64.tar.gz
$ tar zxvf prometheus-2.4.3.linux-amd64.tar.gz
$ cd prometheus-2.4.3.linux-amd64
如果需要添加新的job,在这个文件添加
$ vim prometheus.yml
global:
  scrape_interval:     15s
  evaluation_interval: 15s
  # scrape_timeout is set to the global default (10s).
alerting:
  alertmanagers:
  - static_configs:
    - targets:
      # - alertmanager:9093
rule_files:

scrape_configs:

  - job_name: 'prometheus'
    # metrics_path defaults to '/metrics'
    # scheme defaults to 'http'.
    static_configs:
    - targets: ['localhost:9090']

  - job_name: 'linux1'
    static_configs:
      - targets: ['192.xxx.xx.xx:9100']
        labels:
          instance: server1
  - job_name: 'linux2'
    static_configs:
      - targets: ['192.xxx.xx.xx:9100']
        labels:
          instance: server2
运行 start Prometheus
$ nohup ./prometheus & 改成systemd服务
$ cd ..
$ sudo mv prometheus-2.4.3.linux-amd64 /usr/local/prometheus

$ sudo groupadd prometheus
$ sudo useradd -g prometheus -m -d /usr/local/prometheus -s /sbin/nologin prometheus

$ sudo chown -R prometheus:prometheus /usr/local/prometheus

$ sudo vim /etc/systemd/system/prometheus.service  # 写入如下内容
[Unit]
Description=prometheus
After=network.target
[Service]
Type=simple
User=prometheus
ExecStart=/usr/local/prometheus/prometheus --config.file=/usr/local/prometheus/prometheus.yml --storage.tsdb.path=/usr/local/prometheus
Restart=on-failure
[Install]
WantedBy=multi-user.target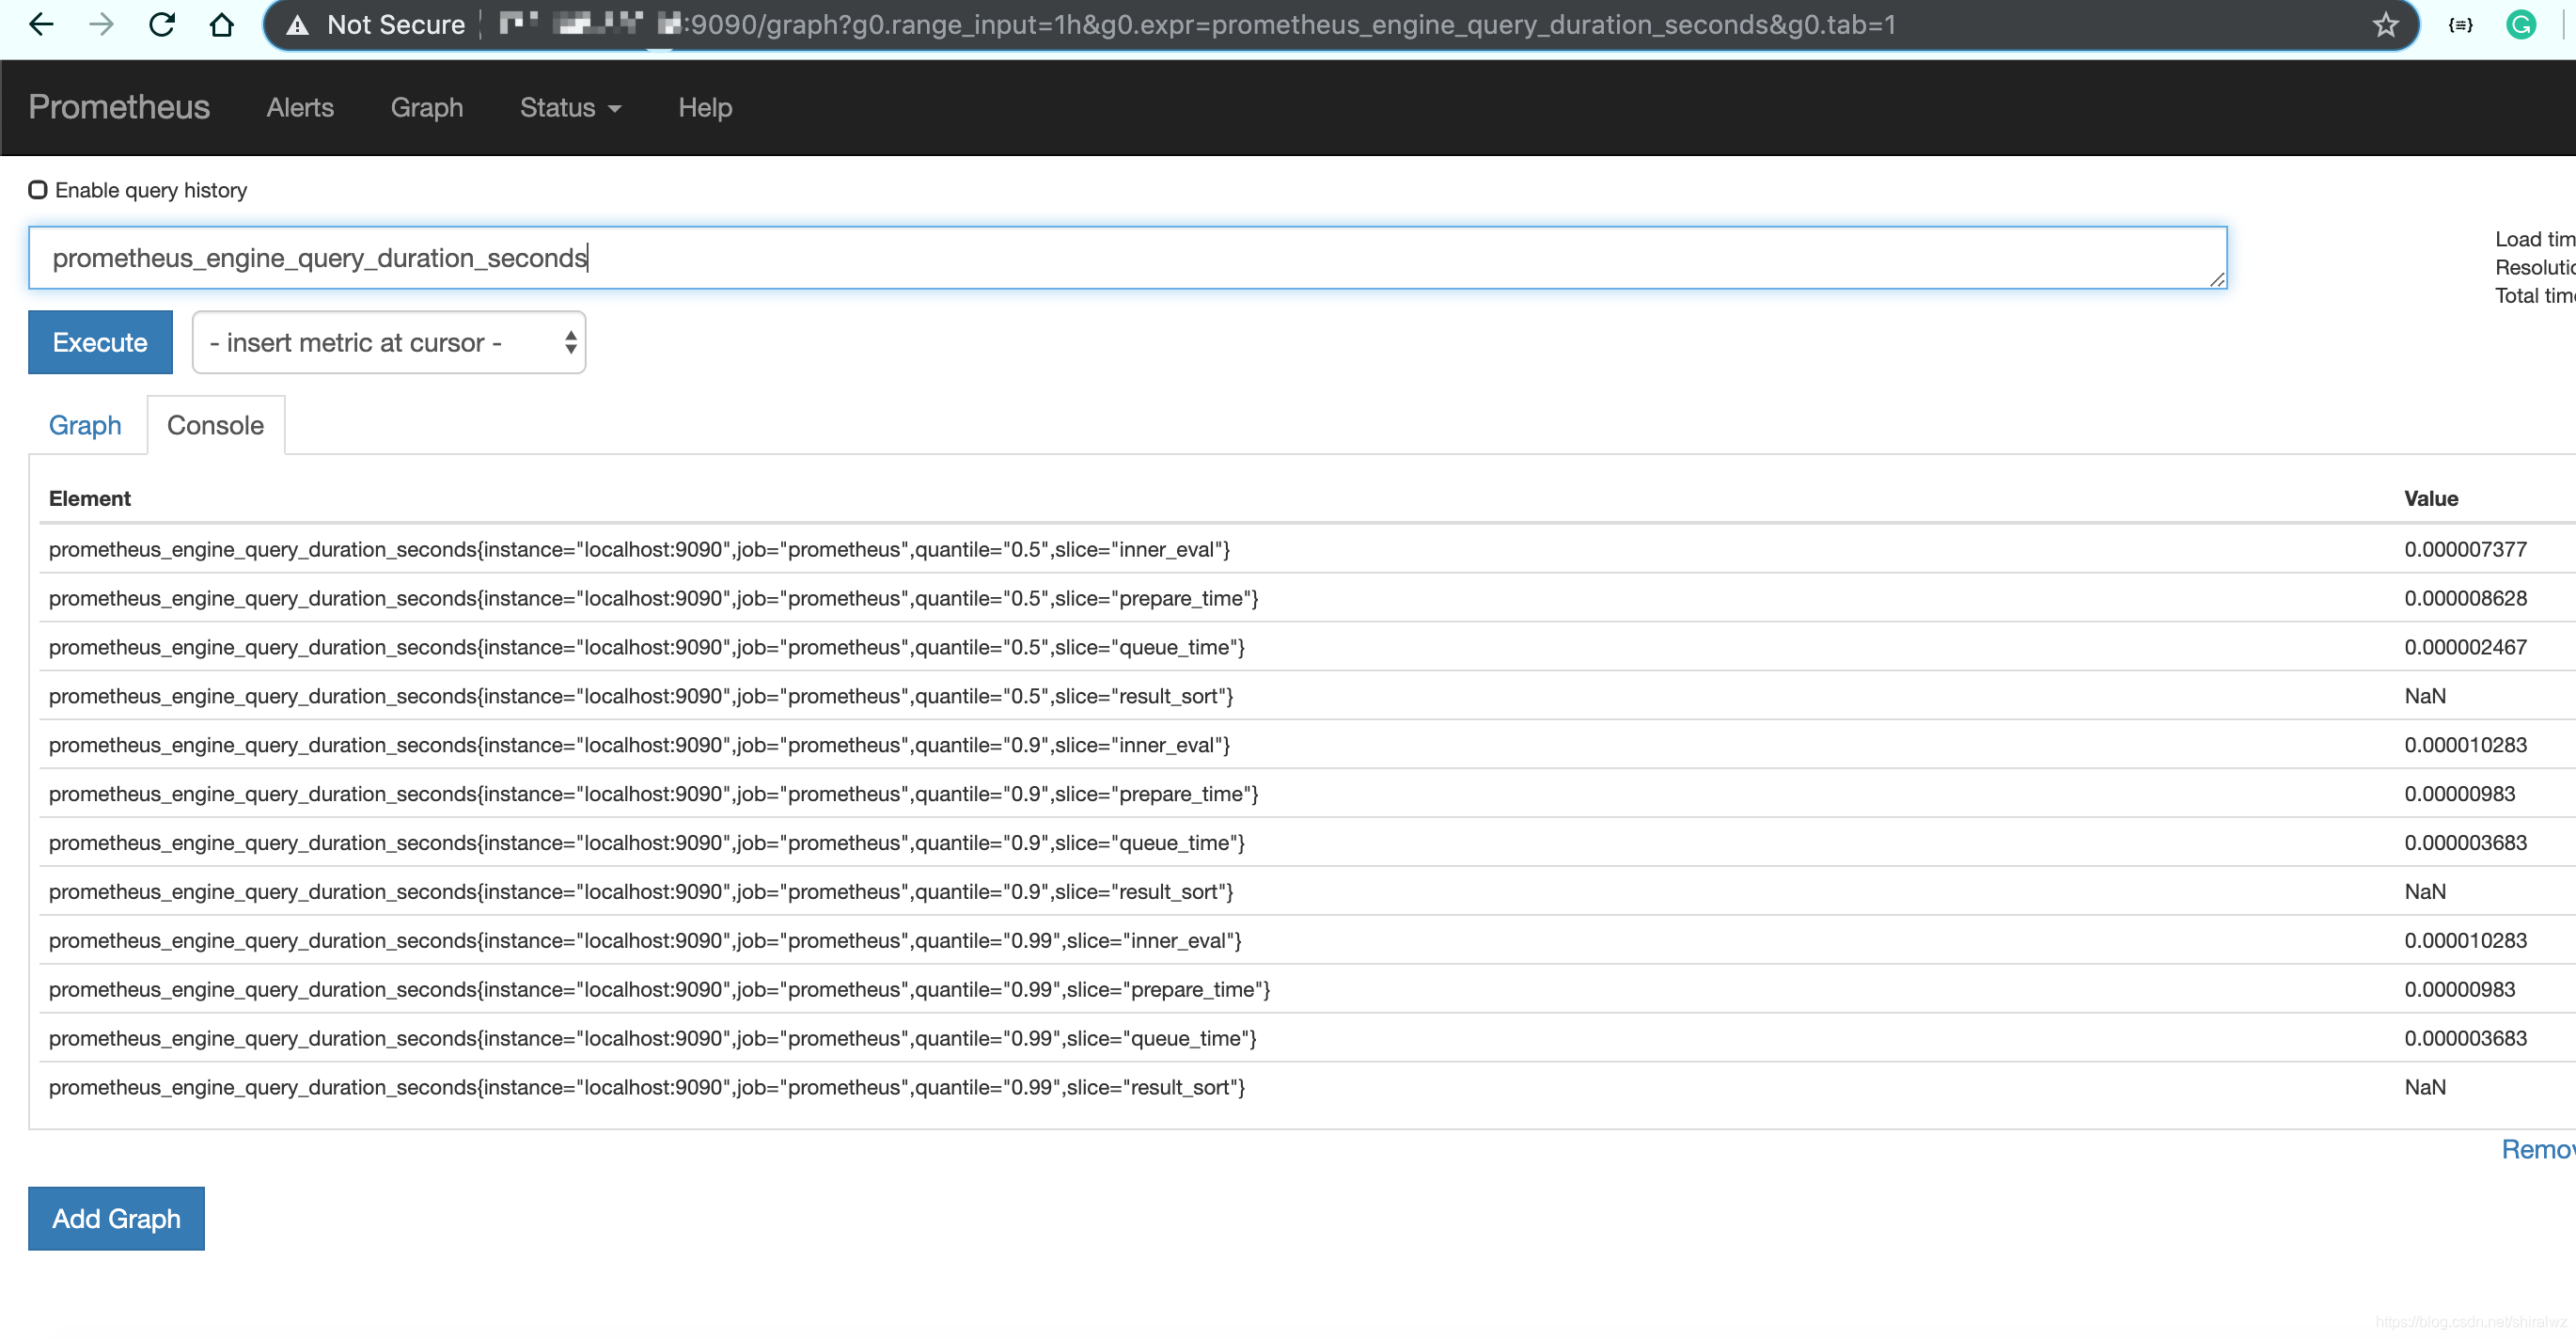
Prometheus自带一个Web网站,默认端口为9090, http://ip:9090.可以查看表达式搜索结果、报警配置、prometheus配置,exporter状态等.
(二) 安装配置Grafana
官方安装文档: https://grafana.com/grafana/download?platform=linux
http://docs.grafana.org/installation/
$ wget https://s3-us-west-2.amazonaws.com/grafana-releases/release/grafana_5.3.0_amd64.deb
$ sudo dpkg -i grafana_5.3.0_amd64.deb

$ sudo systemctl status grafana-server    #默认进入了运行的状态

$ sudo systemctl enable grafana-server

关闭
sudo service grafana-server stop
启动
sudo service grafana-server start
需要开放3000端口的访问权限 https://blog.youkuaiyun.com/zbljz98/article/details/80464761
$ iptables -A INPUT -p tcp --dport 3000 -j ACCEPT
我开始的时候就是没做这一步,导致无法在ip:3000端口访问
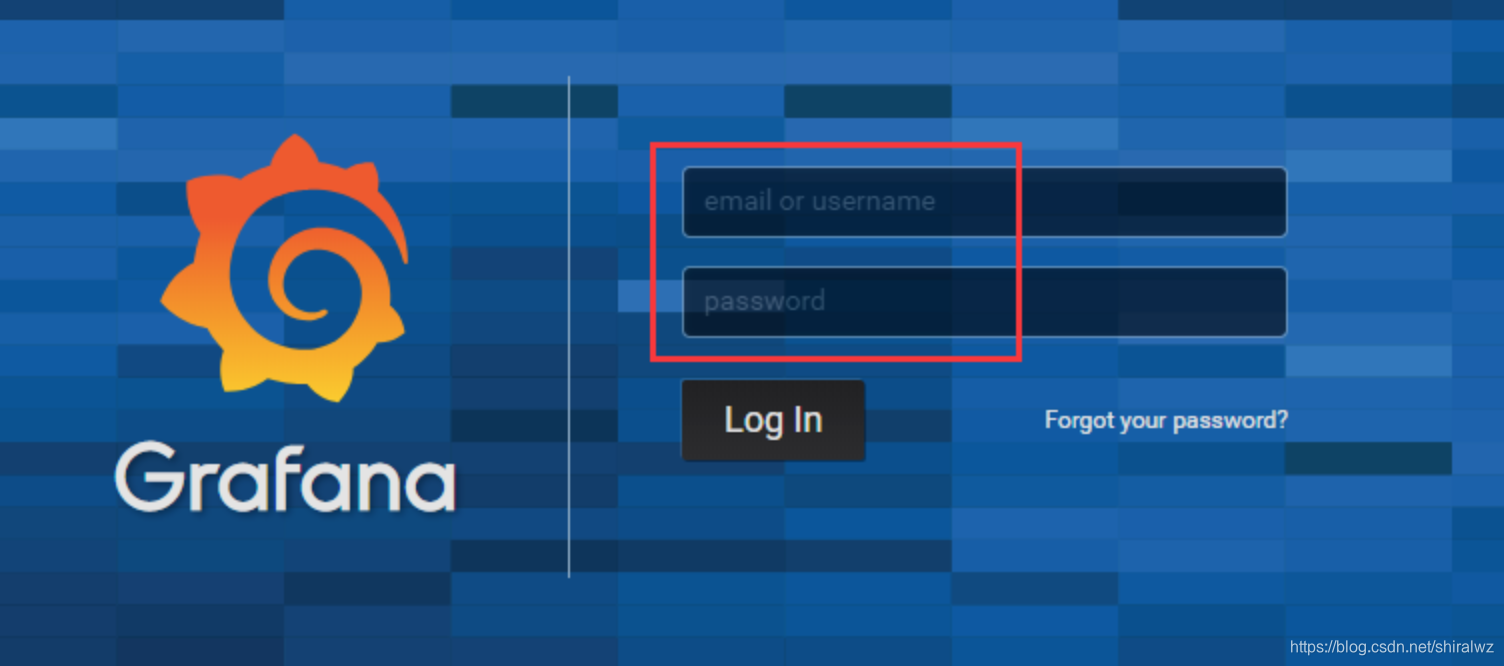
进入登录页面,首次访问的用户名是admin, 密码是 admin
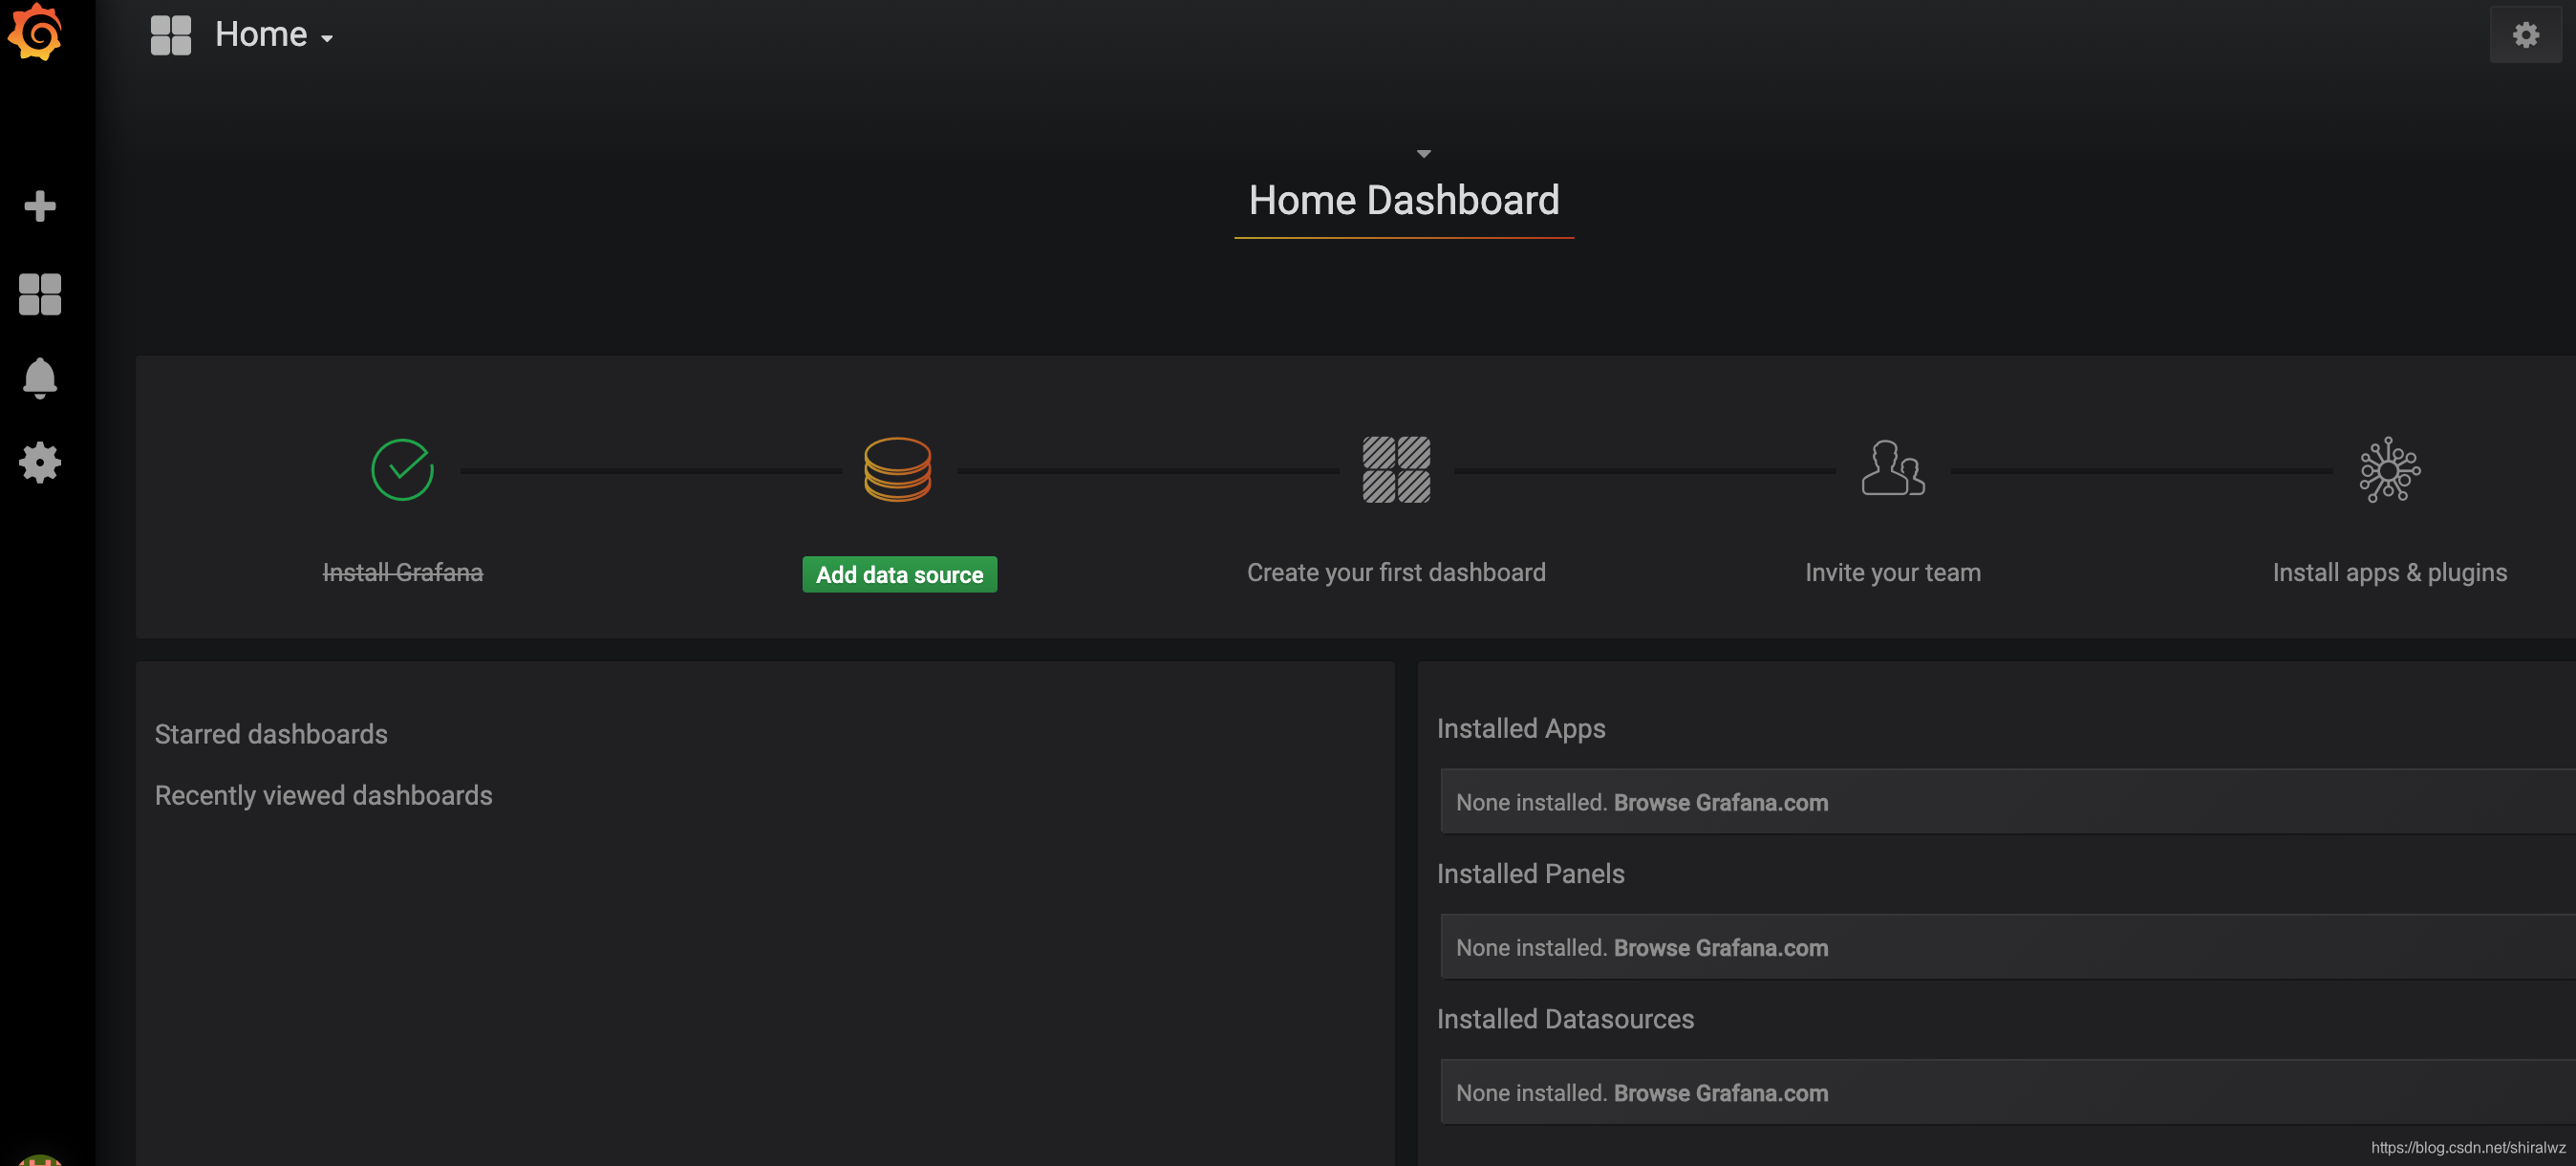
首次登录之后会要求你更换密码


 58
58

 被折叠的 条评论
为什么被折叠?
被折叠的 条评论
为什么被折叠?
 到【灌水乐园】发言


