


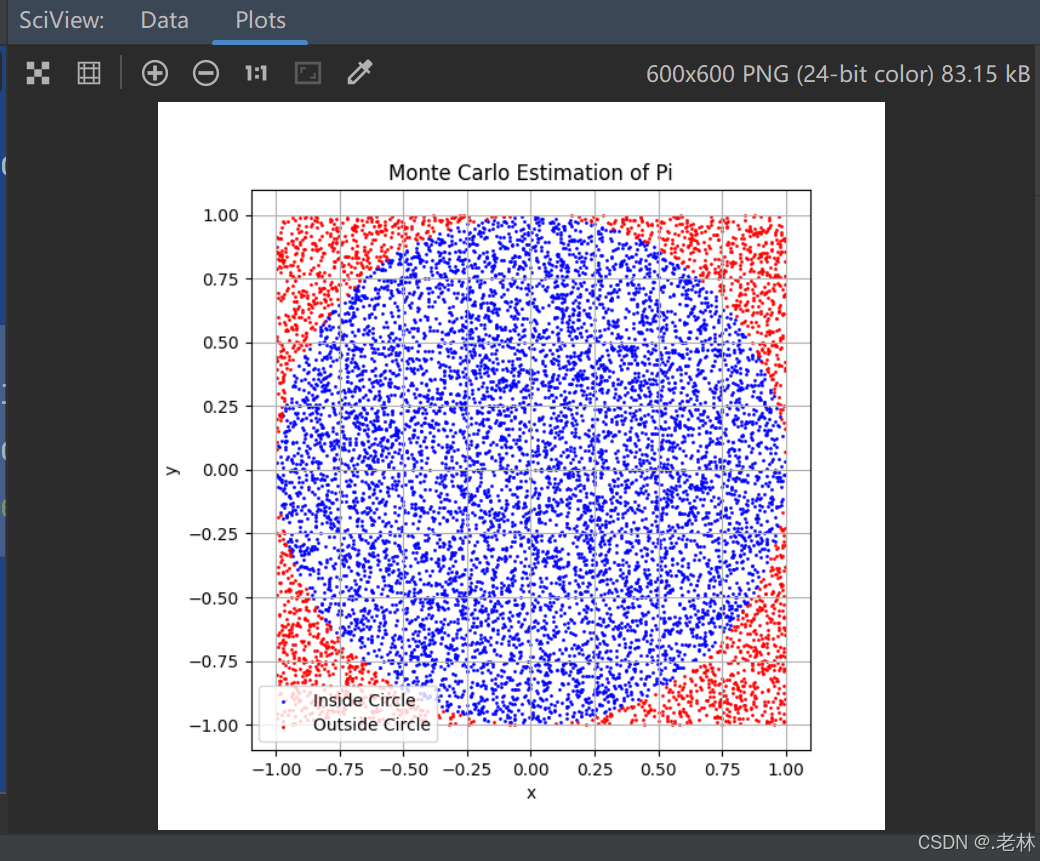
以下是使用蒙特卡罗方法生成单位圆的Python实现,通过随机采样点并可视化结果:
import numpy as np
import matplotlib.pyplot as plt

# 设置随机点数量
n_points = 10000

# 生成随机点
x = np.random.uniform(-1, 1, n_points)
y = np.random.uniform(-1, 1, n_points)

# 计算点到原点的距离
distances = np.sqrt(x**2 + y**2)

# 筛选出在单位圆内的点
inside_circle = distances <= 1

# 绘制图形
plt.figure(figsize=(6, 6))
plt.scatter(x[inside_circle], y[inside_circle], color='blue', s=1, label='Inside Circle')
plt.scatter(x[~inside_circle], y[~inside_circle], color='red', s=1, label='Outside Circle')
plt.gca().set_aspect('equal', adjustable='box')
plt.title('Monte Carlo Estimation of Pi')
plt.xlabel('x')
plt.ylabel('y')
plt.legend()
plt.grid(True)
plt.show()

# 计算π的近似值
pi_estimate = 4 * np.sum(inside_circle) / n_points
print(f"Estimated value of π: {pi_estimate}")
# 输出 Estimated value of π: 3.1488


 1186
1186

 被折叠的 条评论
为什么被折叠?
被折叠的 条评论
为什么被折叠?
 到【灌水乐园】发言


