


DETR,DAB.DN等这几个官方代码下应该都有util这个文件夹,使用plot_utils.py文件可以绘制结果图。
RT-DETR官方代码好像没有这个文件,可以创建一个该文件生成结果图。
需要修改路径等参数,代码如下:
"""
Plotting utilities to visualize training logs.
"""
import torch
import pandas as pd
import numpy as np
import seaborn as sns
import matplotlib.pyplot as plt
from pathlib import Path, PurePath
def plot_logs(logs, fields=('class_error', 'loss_bbox_unscaled', 'mAP'), ewm_col=0, log_name='log.txt'):
'''
Function to plot specific fields from training log(s). Plots both training and test results.
:: Inputs - logs = list containing Path objects, each pointing to individual dir with a log file
- fields = which results to plot from each log file - plots both training and test for each field.
- ewm_col = optional, which column to use as the exponential weighted smoothing of the plots
- log_name = optional, name of log file if different than default 'log.txt'.
:: Outputs - matplotlib plots of results in fields, color coded for each log file.
- solid lines are training results, dashed lines are test results.
'''
func_name = "plot_utils.py::plot_logs"
# verify logs is a list of Paths (list[Paths]) or single Pathlib object Path,
# convert single Path to list to avoid 'not iterable' error
if not isinstance(logs, list):
if isinstance(logs, PurePath):
logs = [logs]
print(f"{func_name} info: logs param expects a list argument, converted to list[Path].")
else:
raise ValueError(f"{func_name} - invalid argument for logs parameter.\n \
Expect list[Path] or single Path obj, received {type(logs)}")
# Quality checks - verify valid dir(s), that every item in list is Path object, and that log_name exists in each dir
for i, dir in enumerate(logs):
if not isinstance(dir, PurePath):
raise ValueError(f"{func_name} - non-Path object in logs argument of {type(dir)}: \n{dir}")
if not dir.exists():
raise ValueError(f"{func_name} - invalid directory in logs argument:\n{dir}")
# verify log_name exists
fn = Path(dir / log_name)
print('fn=',fn)
if not fn.exists():
print(f"-> missing {log_name}. Have you gotten to Epoch 1 in training?")
print(f"--> full path of missing log file: {fn}")
return
# load log file(s) and plot
dfs = [pd.read_json(Path(p) / log_name, lines=True) for p in logs]
# print('dfs=',dfs)
fig, axs = plt.subplots(ncols=len(fields), figsize=(16, 5))
for df, color in zip(dfs, sns.color_palette(n_colors=len(logs))):
for j, field in enumerate(fields):
# 确保字段是数值类型
if field in df.columns:
df[field] = pd.to_numeric(df[field], errors='coerce') # 将字段转换为数值,非数值的变为 NaN
if field == 'mAP':
coco_eval = pd.DataFrame(
np.stack(df.test_coco_eval_bbox.dropna().values)[:, 1]
).ewm(com=ewm_col).mean()
axs[j].plot(coco_eval, c=color)
else:
smoothed_data = df[field].interpolate().ewm(com=ewm_col).mean()
# 进行绘制
smoothed_data.plot(
ax=axs[j],
color=color,
style='-'
)
else:
print(f"Warning: Field '{field}' not found in dataframe.")
for ax, field in zip(axs, fields):
print('6')
ax.legend([Path(p).name for p in logs])
ax.set_title(field)
def plot_precision_recall(files, naming_scheme='iter'):
if naming_scheme == 'exp_id':
# name becomes exp_id
names = [f.parts[-3] for f in files]
elif naming_scheme == 'iter':
names = [f.stem for f in files]
else:
raise ValueError(f'not supported {naming_scheme}')
fig, axs = plt.subplots(ncols=2, figsize=(16, 5))
for f, color, name in zip(files, sns.color_palette("Blues", n_colors=len(files)), names):
data = torch.load(f)
# precision is n_iou, n_points, n_cat, n_area, max_det
precision = data['precision']
recall = data['params'].recThrs
scores = data['scores']
# take precision for all classes, all areas and 100 detections
precision = precision[0, :, :, 0, -1].mean(1)
scores = scores[0, :, :, 0, -1].mean(1)
prec = precision.mean()
rec = data['recall'][0, :, 0, -1].mean()
print(f'{naming_scheme} {name}: mAP@50={prec * 100: 05.1f}, ' +
f'score={scores.mean():0.3f}, ' +
f'f1={2 * prec * rec / (prec + rec + 1e-8):0.3f}'
)
axs[0].plot(recall, precision, c=color)
axs[1].plot(recall, scores, c=color)
axs[0].set_title('Precision / Recall')
axs[0].legend(names)
axs[1].set_title('Scores / Recall')
axs[1].legend(names)
return fig, axs
if __name__ == '__main__':
files = list(Path('/home/kemove/xpy/DN-DETR-main/outputs_light2/eval').glob('*.pth'))
plot_precision_recall(files)
plt.show()
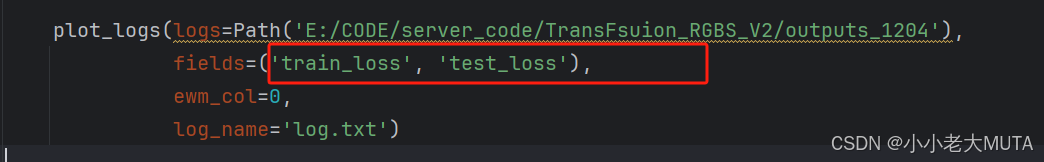
plot_logs(logs=Path('/home/kemove/xpy/DN-DETR-main/outputs_light2'),
fields=('train_loss', 'test_loss'),
ewm_col=0,
log_name='log.txt')
plt.show()
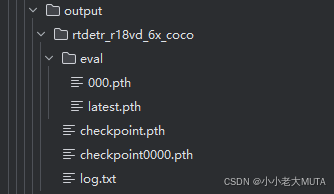
注意两个函数所使用的路径是不一样的,一般训练完成后会生成一个output文件夹,下面包含eval文件夹以及checkpoints.pth和log.txt文件:
plot_precision_recall函数路径到eval文件夹;
plot_logs函数路径到eval的上一级文件夹,即包含log.txt的文件夹
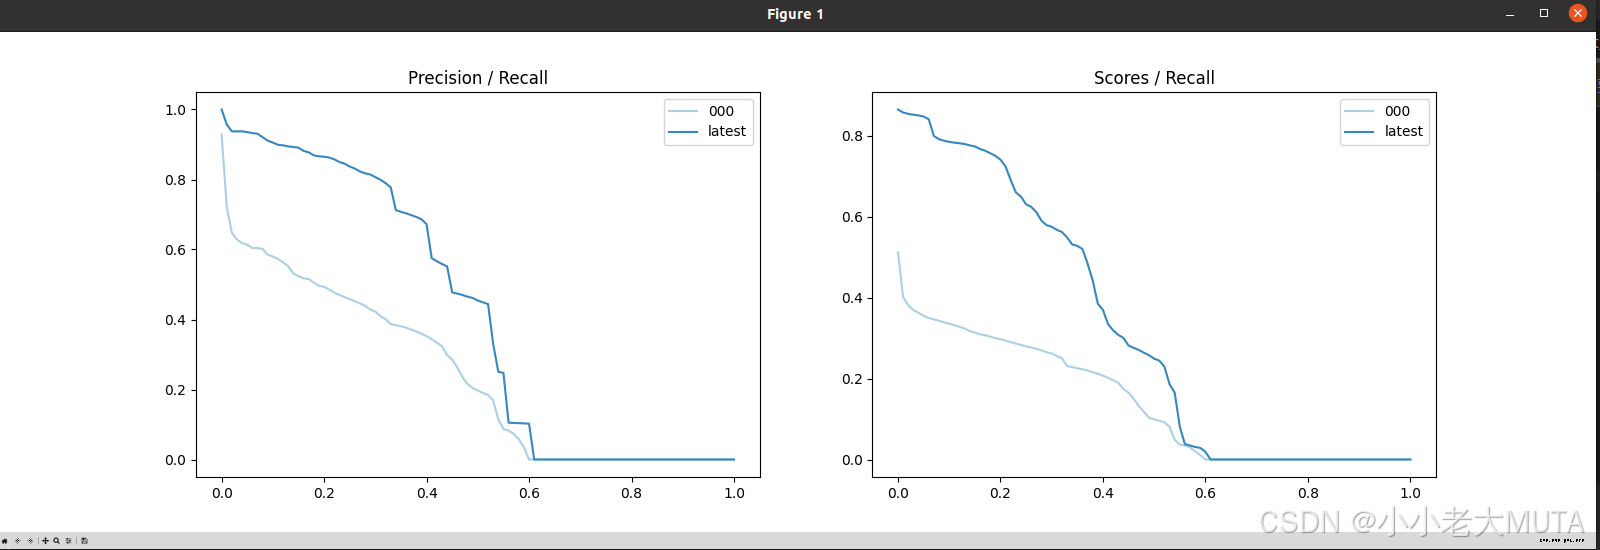
这个文件可以绘制两种指标图:
plot_precision_recall绘制的结果图如下:
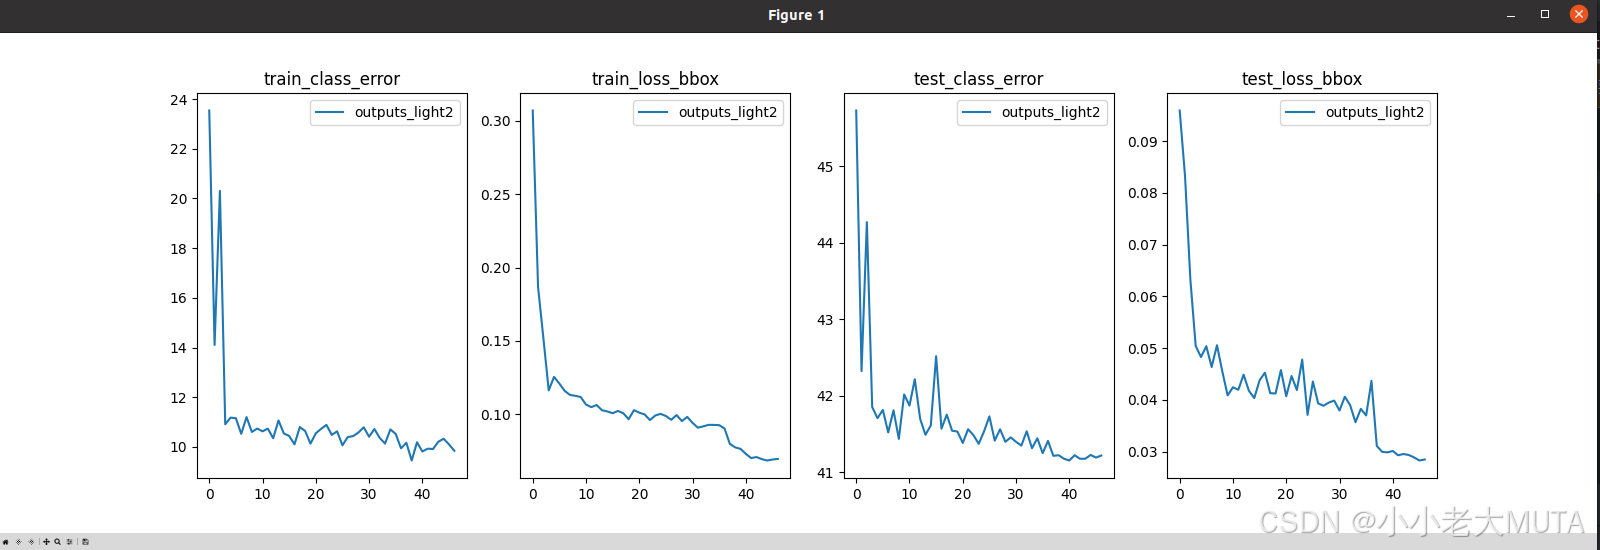
plot_logs绘制的是训练过程中各个损失下降过程:
这里的变量可以选择,查看log.txt文件中有什么变量就可以在这里设置什么变量


 8508
8508

 被折叠的 条评论
为什么被折叠?
被折叠的 条评论
为什么被折叠?
 到【灌水乐园】发言


