仅作自己使用
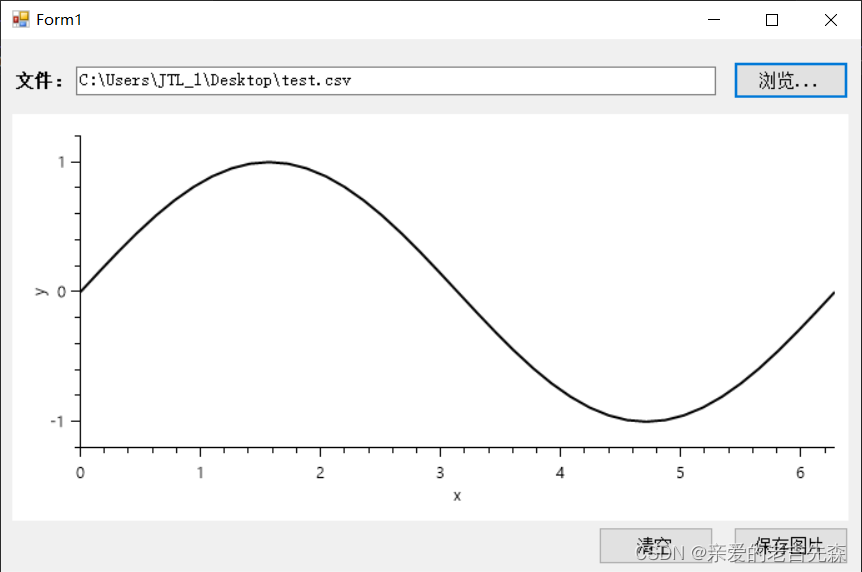
效果
代码
using OxyPlot.Axes;
using OxyPlot.Series;
using OxyPlot.WindowsForms;
using System;
using System.Collections.Generic;
using System.ComponentModel;
using System.Data;
using System.Drawing;
using System.Linq;
using System.Text;
using System.Threading.Tasks;
using OxyPlot;
using System.Windows.Forms;
using System.Drawing.Printing;
namespace Winform_0920
{
public partial class Form1 : Form
{
double[,] data;
LineSeries Ls;
public Form1()
{
InitializeComponent();
InitPlot();
}
private void button_browse_Click(object sender, EventArgs e)
{
OpenFileDialog ofd = new OpenFileDialog();
ofd.Filter = "Excel(*.csv)|*.csv|Excel(*.xls)|*.xls|Excel(*.xlsx)|*.xlsx|Text(*.txt)|*.txt";
if (ofd.ShowDialog() == DialogResult.OK)
{
textBox_fileName.Text = ofd.FileName;
data = LoadData(ofd.FileName);
Plot();
}
}
void InitPlot()
{
plotView.Model = new PlotModel();
plotView.Model.Background = OxyColors.White;
plotView.Model.PlotAreaBorderThickness = new OxyThickness(0);
Axis x = new LinearAxis();
x.AxislineStyle = LineStyle.Solid;
x.Minimum = 0;
x.Maximum = 2 * Math.PI;
x.Title = "x";
x.Position = AxisPosition.Bottom;
plotView.Model.Axes.Add(x);
Axis y = new LinearAxis();
y.AxislineStyle = LineStyle.Solid;
y.Minimum = -1.2;
y.Maximum = 1.2;
y.Position = AxisPosition.Left;
y.Title = "y";
plotView.Model.Axes.Add(y);
}
void Plot()
{
Ls = new LineSeries() { Title = "xy" };
for (int i = 0; i < data.GetLength(1); i++)
{
Ls.Points.Add(new DataPoint(data[0, i], data[1, i]));
}
Ls.Color = OxyColors.Black;
plotView.Model.Series.Add(Ls);
plotView.InvalidatePlot(true);
}
private double[,] LoadData(string filePath)
{
string[] strArray = System.IO.File.ReadAllLines(filePath);
string[] xStr = strArray[0].Split(',');
string[] yStr = strArray[1].Split(',');
double[] x = new double[xStr.Length];
double[] y = new double[yStr.Length];
double[,] data = new double[x.Length, y.Length];
for (int i = 0; i < x.Length; i++)
{
x[i] = double.Parse(xStr[i]);
y[i] = double.Parse(yStr[i]);
}
for (int i = 0; i < x.Length; i++)
{
data[0, i] = x[i];
data[1, i] = y[i];
}
return data;
}
private void button_clear_Click(object sender, EventArgs e)
{
plotView.Model.Series.Clear();
plotView.InvalidatePlot(true);
}
private void button_save_Click(object sender, EventArgs e)
{
SaveFileDialog sf = new SaveFileDialog();
sf.Filter = "PNG|*.png|PDF|*.pdf";
if (sf.ShowDialog() == DialogResult.OK)
{
switch (sf.FilterIndex)
{
case 0:
{
PngExporter pe = new PngExporter();
pe.Width = plotView.Width;
pe.Height = plotView.Height;
pe.Resolution = 1920 * 1680;
pe.ExportToFile(plotView.Model, sf.FileName);
break;
}
case 1:
{
PdfExporter pe = new PdfExporter();
pe.Width = plotView.Width;
pe.Height = plotView.Height;
pe.ExportToFile(plotView.Model, sf.FileName);
break;
}
}
MessageBox.Show("保存完成~");
}
}
}
}


 被折叠的 条评论
为什么被折叠?
被折叠的 条评论
为什么被折叠?
 到【灌水乐园】发言


