


文章目录
一:自定义监控进程
编写进程脚本
修改/usr/local/etc/zabbix_agentd.conf文件
UnsafeUserParameters=1
UserParameter=< key >,< command >
重启zabbix_agent
在web界面配置监控项和触发器
1.1编写进程脚本(客户端)
[root@zabbix-server script]# cat check_process.sh
#!/bin/bash
count=$(ps -ef |grep -Ev "grep|$0"|grep  $1|wc -l)
#-EV:扩展正则表达式,反匹配去掉"grep"这一行以及脚本本身进程,$1:自定义变量,wc -l 最后查看进程的数量
if [ $count -ne 0  ];then   #进程数有则显示0,进程数量没有则显示1
  echo 0
else
  echo 1
fi
1.2修改/usr/local/etc/zabbix_agentd.conf文件(客户端)
[root@zabbix-agent ~]# vim /usr/local/etc/zabbix_agentd.conf
# Mandatory: no
# Range: 0-1
# Default:
UnsafeUserParameters=1    #启用自定义监控项{1|0}

# Default: SOMAXCONN (hard-coded constant, depends on system)
# ListenBacklog=
UserParameter=check_process[*],/scripts/check_process.sh $1   #指定自定义监控脚本参数
#格式:UserParameter=<key>,<shell command> $1
1.3重启zabbix_agent(客户端)
[root@zabbix-agent ~]# killall zabbix_agentd
[root@zabbix-agent ~]# zabbix_agentd
1.4配置监控项和触发器等先在(zabbix服务端进行测试)
#先查看客户端开启了哪些服务
[root@zabbix-agent ~]# ss -antl
State              Recv-Q             Send-Q                         Local Address:Port                          Peer Address:Port            Process
LISTEN             0                  128                                  0.0.0.0:22 (sshd)                                 0.0.0.0:*
LISTEN             0                  128                                  0.0.0.0:10050 (zabbix_agentd)                          0.0.0.0:*
LISTEN             0                  128                                        *:80(httpd)                                       *:*
LISTEN             0                  128                                     [::]:22                                    [::]:*

#-s:指定主机的主机名或IP地址  -k:k键指定要为其检索值的项的键
[root@zabbix ~]# zabbix_get -s 192.168.136.219 -k check_process[sshd]
0
[root@zabbix ~]# zabbix_get -s 192.168.136.219 -k check_process[httpd]
0
[root@zabbix ~]# zabbix_get -s 192.168.136.219 -k check_process[mysql]
1
[root@zabbix ~]# zabbix_get -s 192.168.136.219 -k check_process[zabbix_agent]
0
#只要没有开启服务则显示1,否则0代表开启服务
1.5web界面配置监控项和触发器
![[外链图片转存失败,源站可能有防盗链机制,建议将图片保存下来直接上传(img-NdngiYQG-1633752244816)(2021-10-8 zabbix自定义监控 170920.assets/QQ截图20211008222902.png)]](https://i-blog.csdnimg.cn/blog_migrate/073f1e714d2f3c01fc5a25c0e69c0d73.png)
![1633752244820)(2021-10-8 zabbix自定义监控 170920.assets/QQ截图20211008223112.png)]](https://i-blog.csdnimg.cn/blog_migrate/41bf4e89551b551d19521cd988a101e0.png)
![[外链图片转存失败,源站可能有防盗链机制,建议将图片保存下来直接上传(img-IZAH0iOT-1633752244821)(2021-10-8 zabbix自定义监控 170920.assets/QQ截图20211008223546.png)]](https://i-blog.csdnimg.cn/blog_migrate/025b47769233b07df1b0d908c7eeae70.png)
![[外链图片转存失败,源站可能有防盗链机制,建议将图片保存下来直接上传(img-Z42TYlPQ-1633752244822)(2021-10-8 zabbix自定义监控 170920.assets/QQ截图20211008223820.png)]](https://i-blog.csdnimg.cn/blog_migrate/06a3624a938192860c1bfacd720f5d12.png)
1.6关闭httpd服务触发告警(客户端)
[root@zabbix-agent ~]# systemctl stop httpd.service
[root@zabbix-agent ~]# ss -antl
State              Recv-Q             Send-Q                         Local Address:Port                          Peer Address:Port            Process
LISTEN             0                  128                                  0.0.0.0:22                                 0.0.0.0:*
LISTEN             0                  128                                  0.0.0.0:10050                              0.0.0.0:*
LISTEN             0                  128                                     [::]:22                                    [::]:*
![[外链图片转存失败,源站可能有防盗链机制,建议将图片保存下来直接上传(img-B3W5U4j4-1633752244823)(2021-10-8 zabbix自定义监控 170920.assets/QQ截图20211008224147.png)]](https://i-blog.csdnimg.cn/blog_migrate/d6eb891f34e066bc142b67339c4d004f.png)
配置过媒介和触发动作之后(也之前配置一样,没有修改的地方)
1.7查看报警效果
![[外链图片转存失败,源站可能有防盗链机制,建议将图片保存下来直接上传(img-XpIBKOiW-1633752244824)(2021-10-8 zabbix自定义监控 170920.assets/QQ截图20211008224737.png)]](https://i-blog.csdnimg.cn/blog_migrate/f1308ae6048b3d228977bc16c501160c.png)
![[外链图片转存失败,源站可能有防盗链机制,建议将图片保存下来直接上传(img-E88NzS7l-1633752244825)(2021-10-8 zabbix自定义监控 170920.assets/QQ截图20211008224852.png)]](https://i-blog.csdnimg.cn/blog_migrate/66a079253fc76e88c346213e64fbf0b4.png)
二:自定义监控日志
2.1 配置日志脚本文件(客户端)
#从github下载日志脚本到本地
[root@zabbix-agent ~]# yum -y install git
[root@zabbix-agent ~]# git clone https://github.com/chendao2015/pyscripts.git
[root@zabbix-agent ~]# tree pyscripts/
pyscripts/
├── 定时发微信群消息.zip
├── dmp4.py
├── log.py
├── mail_send.py
└── README.md

#复制日志脚本到存放脚本的目录下
[root@zabbix-agent ~]# cp pyscripts/log.py  /scripts/
[root@zabbix-agent ~]# cat /scripts/log.py
 seekfile = '/tmp/logseek'	#会将当前读取的信息存放到此目录
      tagKey = 'Error'		#当遇到Error字段会显示报错信息

#安装python3.8
[root@zabbix-agent ~]# yum -y install python38
#查看到httpd的日志目录
[root@zabbix-agent ~]# find / -name *httpd
/var/log/httpd
#为httpd日志目录设置属主与权限
[root@zabbix-agent tmp]# chmod 755 /var/log/httpd/
[root@zabbix-agent tmp]# chown zabbix: /var/log/httpd/


#创建读取日志信息的目录
[root@zabbix-agent ~]# mkdir /zabbix-item_log
[root@zabbix-agent ~]# chown -R zabbix: /zabbix-item_log/
脚本的用法
python3.8 /scripts/log.py(脚本) /var/log/httpd/error_log(httpd日志文件) /zabbix-item_log/logseek(自定义存放读取信息的文件)Error(搜索关键字)
2.2修改客户端配置文件
[root@zabbix-agent ~]# vim /usr/local/etc/zabbix_agentd.conf
UnsafeUserParameters=1
UserParameter=check_process[*],/scripts/check_process.sh $1
UserParameter=check_log[*],/scripts/log.py $1 $2 $3      #key是log,传3个变量参数
#重新开启zabbix_agentd
[root@zabbix-agent ~]# killall zabbix_agentd
[root@zabbix-agent ~]# zabbix_agentd
2.3服务端上进行测试
#先在客户端上给予日志脚本执行权限
[root@zabbix-agent scripts]# chmod +x log.py
[root@zabbix-agent scripts]# ls
check_process.sh  log.py
#客户端上输入错误日志
[root@zabbix-agent scripts]# echo 'Error' >> /var/log/httpd/error_log

#服务端上测试验证
[root@zabbix ~]# zabbix_get -s 192.168.136.219 -k check_log['/var/log/httpd/error_log','/zabbix-item_log/logseek','Error']
1
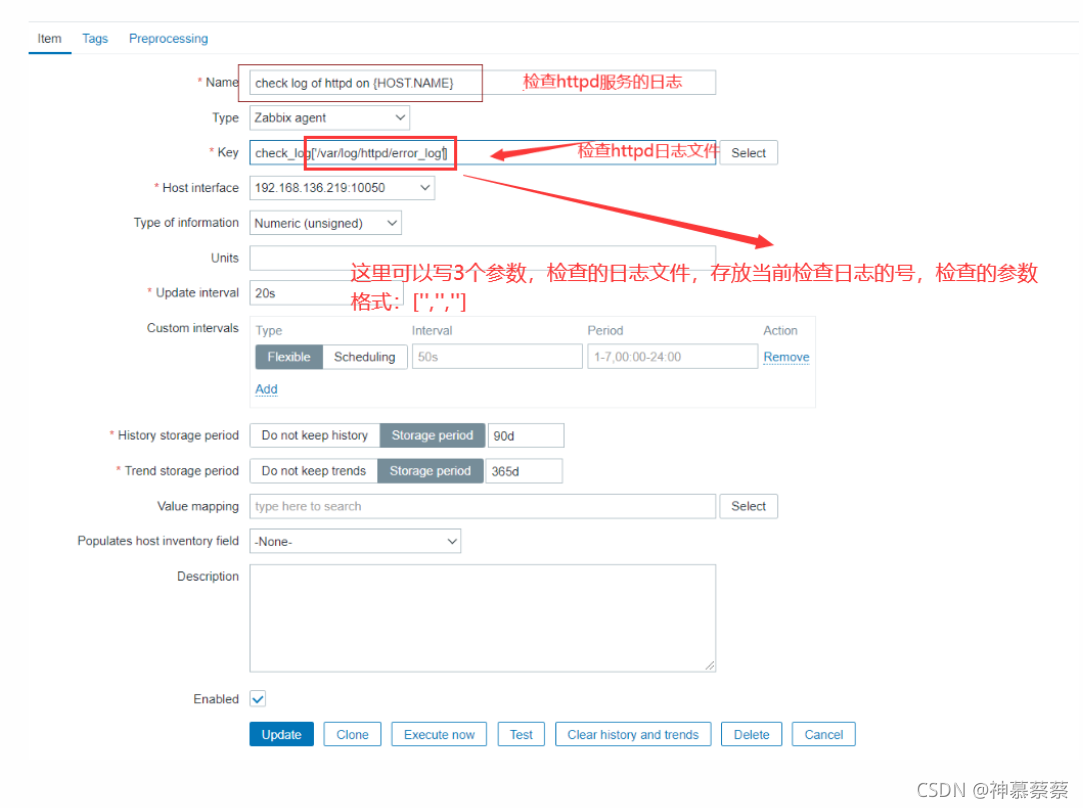
2.4web界面配置监控项和触发器
添加监控项
![[外链图片转存失败,源站可能有防盗链机制,建议将图片保存下来直接上传(img-NMUNFNfQ-1633752244825)(2021-10-8 zabbix自定义监控 170920.assets/QQ截图20211009003552.png)]](https://i-blog.csdnimg.cn/blog_migrate/bafa028be095351bdd4135a04f2ec8f7.png)
监控项多功能监控(自选)
添加触发器
![[外链图片转存失败,源站可能有防盗链机制,建议将图片保存下来直接上传(img-CIffAKVt-1633752244827)(2021-10-8 zabbix自定义监控 170920.assets/QQ截图20211009004304.png)]](https://i-blog.csdnimg.cn/blog_migrate/ad2371c43bc702058f1f2b7875e7dc9d.png)
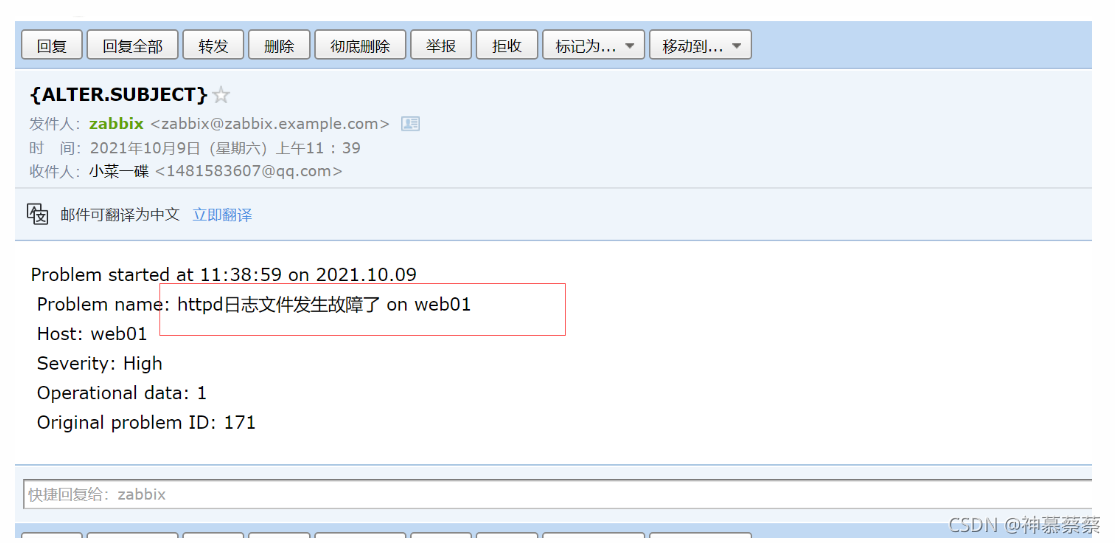
2.5验证触发报警
#(客户端)在日志文件内加错误的信息
[root@zabbix-agent scripts]# echo 'Error' >> /var/log/httpd/error_log
配置过媒介和触发动作以及媒介类型之后(也之前邮箱告警配置一样,没有修改的地方)
2.6查看触发报警的效果


 393
393

 被折叠的 条评论
为什么被折叠?
被折叠的 条评论
为什么被折叠?
 到【灌水乐园】发言


