


% addcolorplus测试
%% 单色
% 导入数据
load data xfit yfit xdata_m ydata_m ydata_s xVdata yVdata xmodel ymodel ...
ymodelL ymodelU c cint
% 设置颜色,需要把addcolorplus.p这个文件放在当前文件下
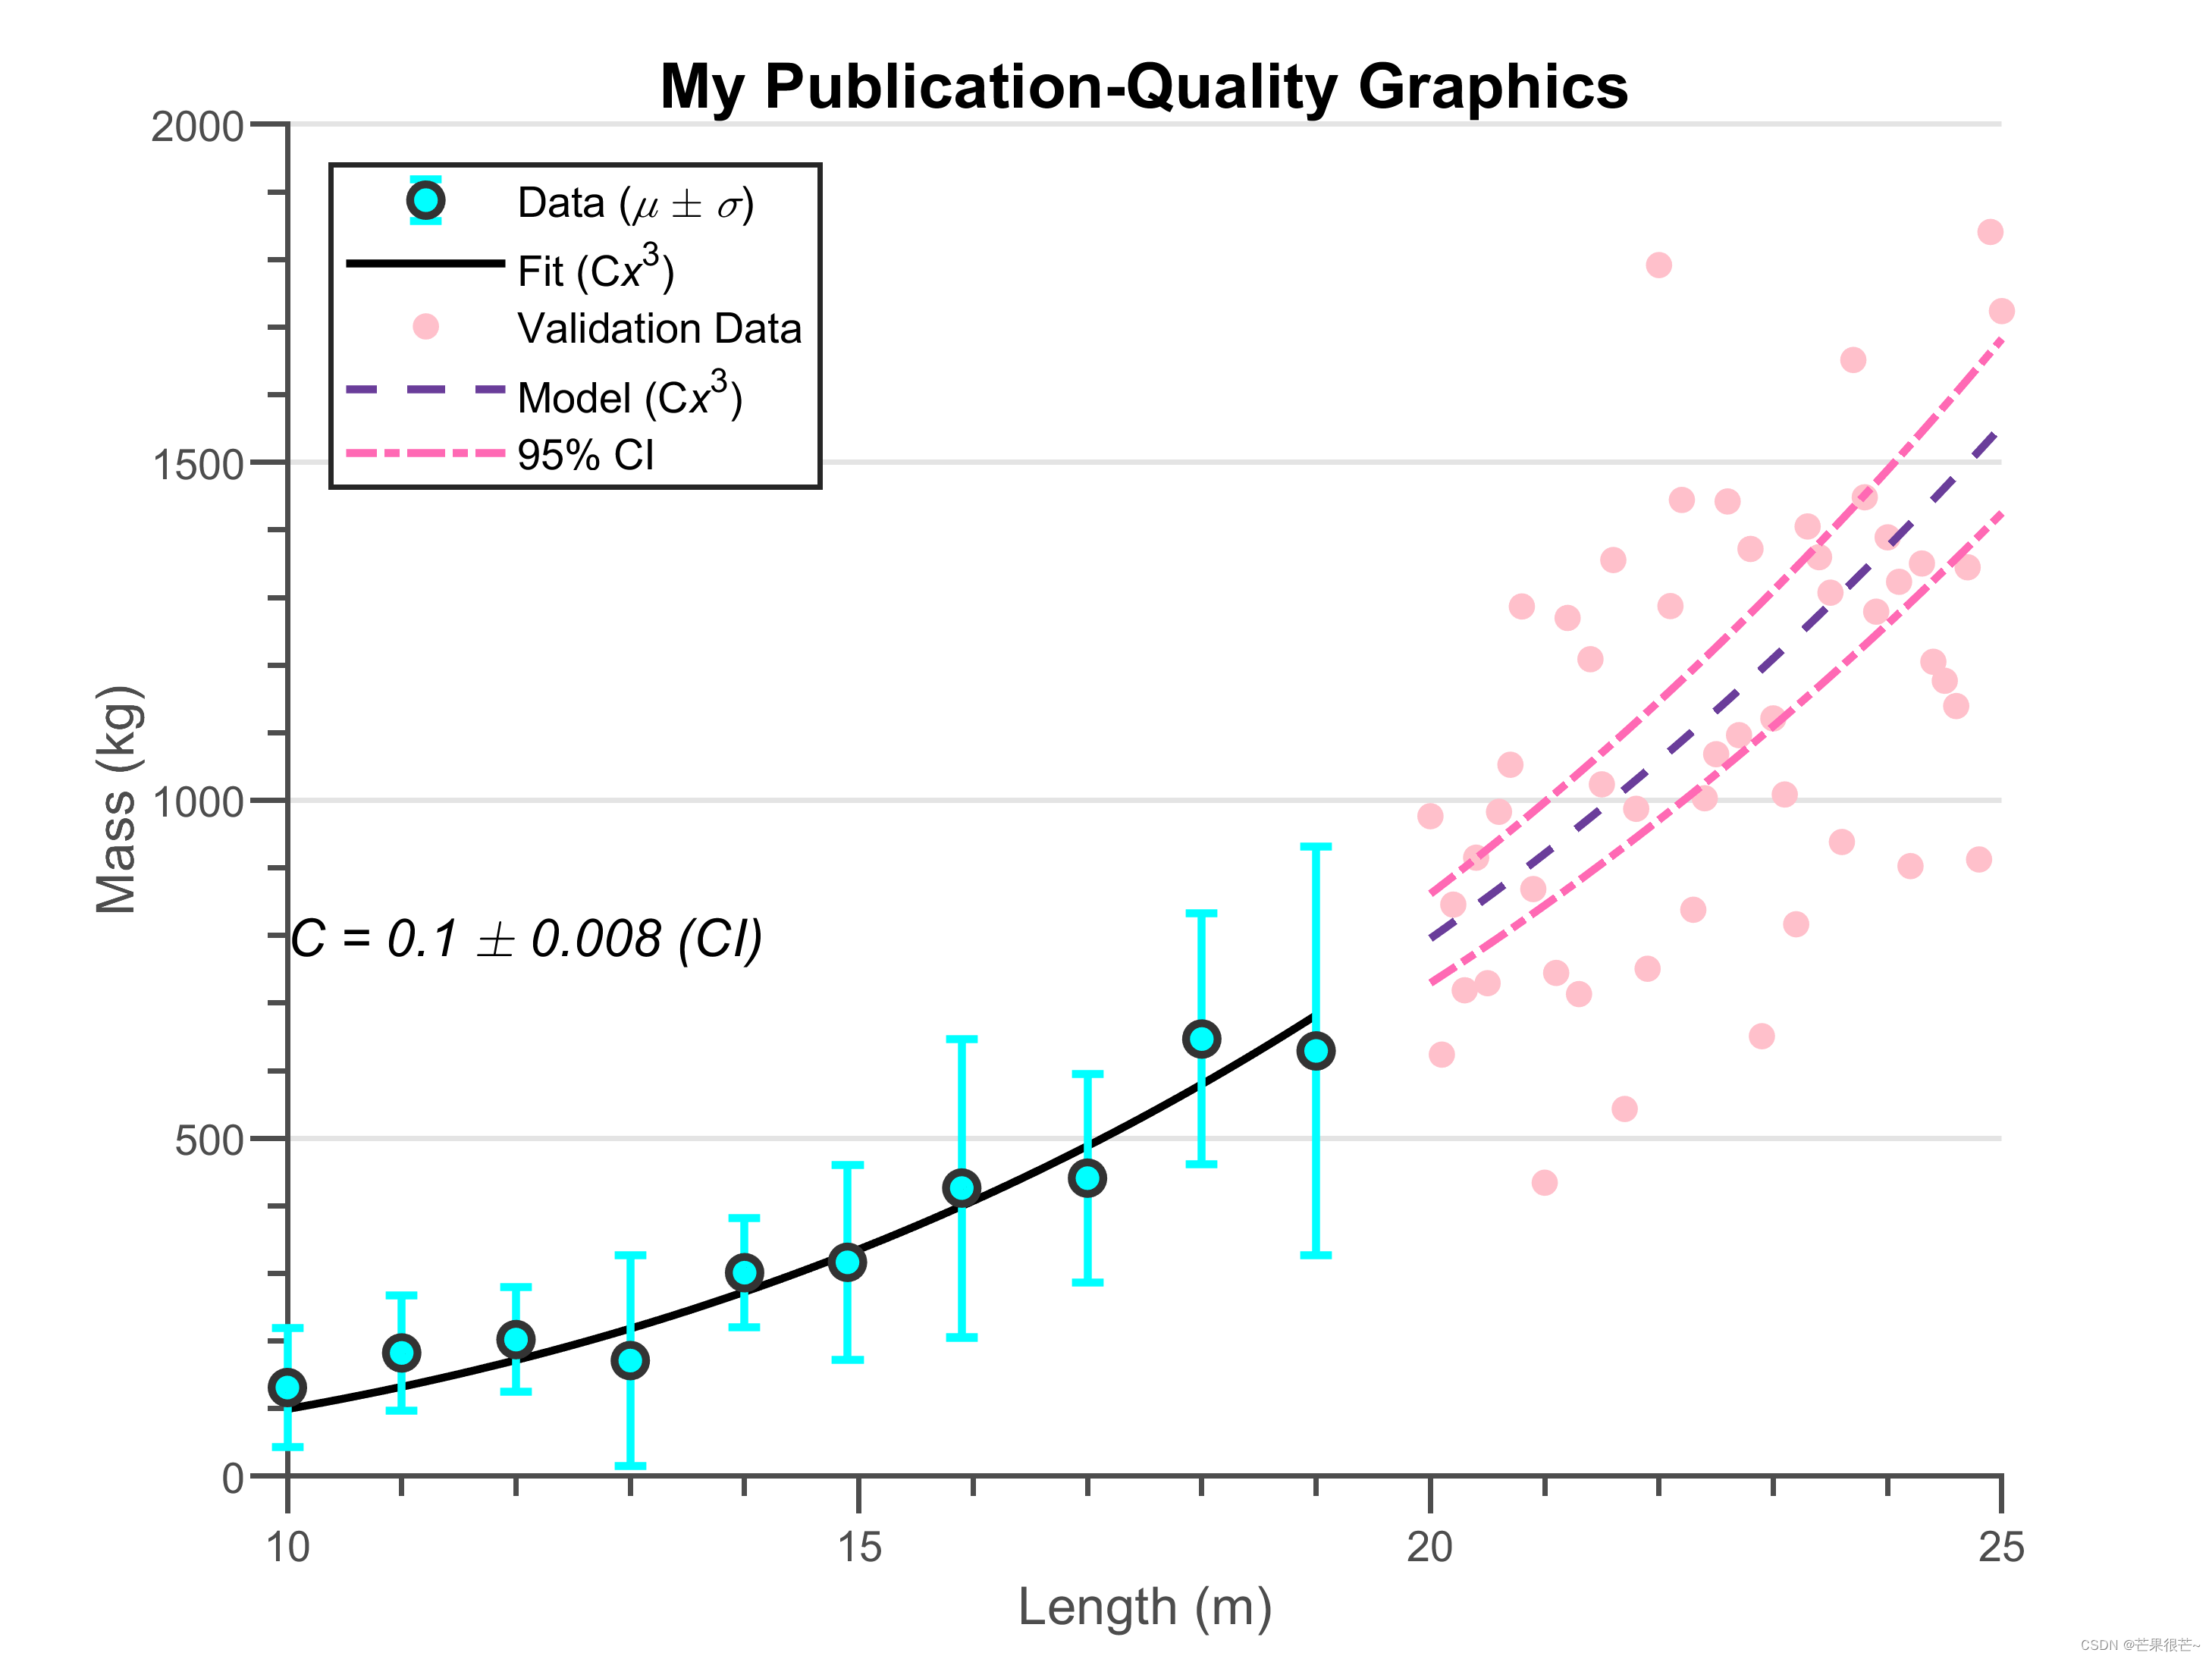
color_hFit = addcolorplus(1); %黑色
color_hE = addcolorplus(93); %亮蓝色
color_hModel = addcolorplus(168); %深紫色
color_hData = addcolorplus(140);%浅粉色
color_hCI1 = addcolorplus(136); %深粉色
color_hCI2 = addcolorplus(136);
% 绘图
figure
hold on
hFit = line(xfit , yfit);
hE = errorbar(xdata_m, ydata_m, ydata_s); %绘制误差线图,其中 xdata_m 和 ydata_m 定义了数据点的位置
hData = line(xVdata, yVdata);
hModel = line(xmodel, ymodel);
hCI(1) = line(xmodel, ymodelL);
hCI(2) = line(xmodel, ymodelU);
% 设置线属性
set(hFit, 'Color', color_hFit) %黑色
set(hE, 'LineStyle', 'none', 'Marker', '.', 'Color', color_hE) %将对象 hE 的线条样式属性设置为无线条('none'),标记样式属性设置为点('.'),亮蓝色
set(hData, 'LineStyle', 'none', 'Marker', '.')
set(hModel, 'LineStyle', '--', 'Color', color_hModel) %-- 深紫色
set(hCI(1), 'LineStyle', '-.', 'Color', color_hCI1) %-.粉色
set(hCI(2), 'LineStyle', '-.', 'Color', color_hCI2) %-.粉色
set(hFit, 'LineWidth', 1.5)
set(hE, 'LineWidth', 1.5, 'Marker', 'o', 'MarkerSize', 6, ...
'MarkerEdgeColor', [.2 .2 .2], 'MarkerFaceColor' , color_hE) %设置对象hE的线宽为1.5,标记为圆形,大小为6,边缘颜色为[.2 .2 .2],填充颜色为变量color_hE黑色
set(hData, 'Marker', 'o', 'MarkerSize', 5, ...
'MarkerEdgeColor', 'none', 'MarkerFaceColor', color_hData) %设置对象hData的标记为圆形,大小为5,边缘颜色为无('none'),填充颜色为变量color_hData浅粉色
set(hModel, 'LineWidth', 1.5)
set(hCI(1), 'LineWidth', 1.5)
set(hCI(2), 'LineWidth', 1.5)
% 添加label
hTitle = title('My Publication-Quality Graphics');
hXLabel = xlabel('Length (m)');
hYLabel = ylabel('Mass (kg)');
% 文字注释
hText = text(10, 800, ...
sprintf('{\\itC = %0.1g \\pm %0.1g (CI)}', c, cint(2)-c)); %在坐标 (10, 800) 处创建文本对象
% 图例
hLegend = legend([hE, hFit, hData, hModel, hCI(1)], ...
'Data ({\it\mu} \pm {\it\sigma})', 'Fit (C{\itx}^3)', ... % C 和 x 是正常字母,而 {} 内的 {\it} 表示将 x 设置为斜体字体
'Validation Data', 'Model (C{\itx}^3)', '95% CI', ...
'Location', 'NorthWest'); %指定图例的位置为左上角,误差线对象 hE、拟合曲线对象 hFit、验证数据对象 hData、模型曲线对象 hModel,以及置信区间下限对象 hCI(1)
% 设置字体
set(gca, 'FontName', 'Helvetica')
set([hTitle, hXLabel, hYLabel, hText], 'FontName', 'AvantGarde')
set([hLegend, gca], 'FontSize', 8)
set([hXLabel, hYLabel, hText], 'FontSize', 10)
set(hTitle, 'FontSize', 12, 'FontWeight' , 'bold')
% 设置坐标轴属性
set(gca, 'Box', 'off', 'TickDir', 'out', 'TickLength', [.02 .02], ... %关闭坐标轴的边框,设置刻度线的方向为外部,设置刻度线的长度为 [0.02 0.02]。
'XMinorTick', 'on', 'YMinorTick', 'on', 'YGrid', 'on', ... %打开次要刻度线和 Y 轴网格线的显示
'XColor', [.3 .3 .3], 'YColor', [.3 .3 .3], 'YTick', 0:500:2500, ...%X 轴和 Y 轴的颜色为 [0.3 0.3 0.3],即灰色;设置 Y 轴的刻度为从 0 到 2500,步长为 500
'LineWidth', 1) %设置坐标轴的线宽为 1
print('test.png','-dpng','-r500') %将当前图形保存为名为 "test.png" 的 PNG 格式图片,并设置分辨率为 500 dpi
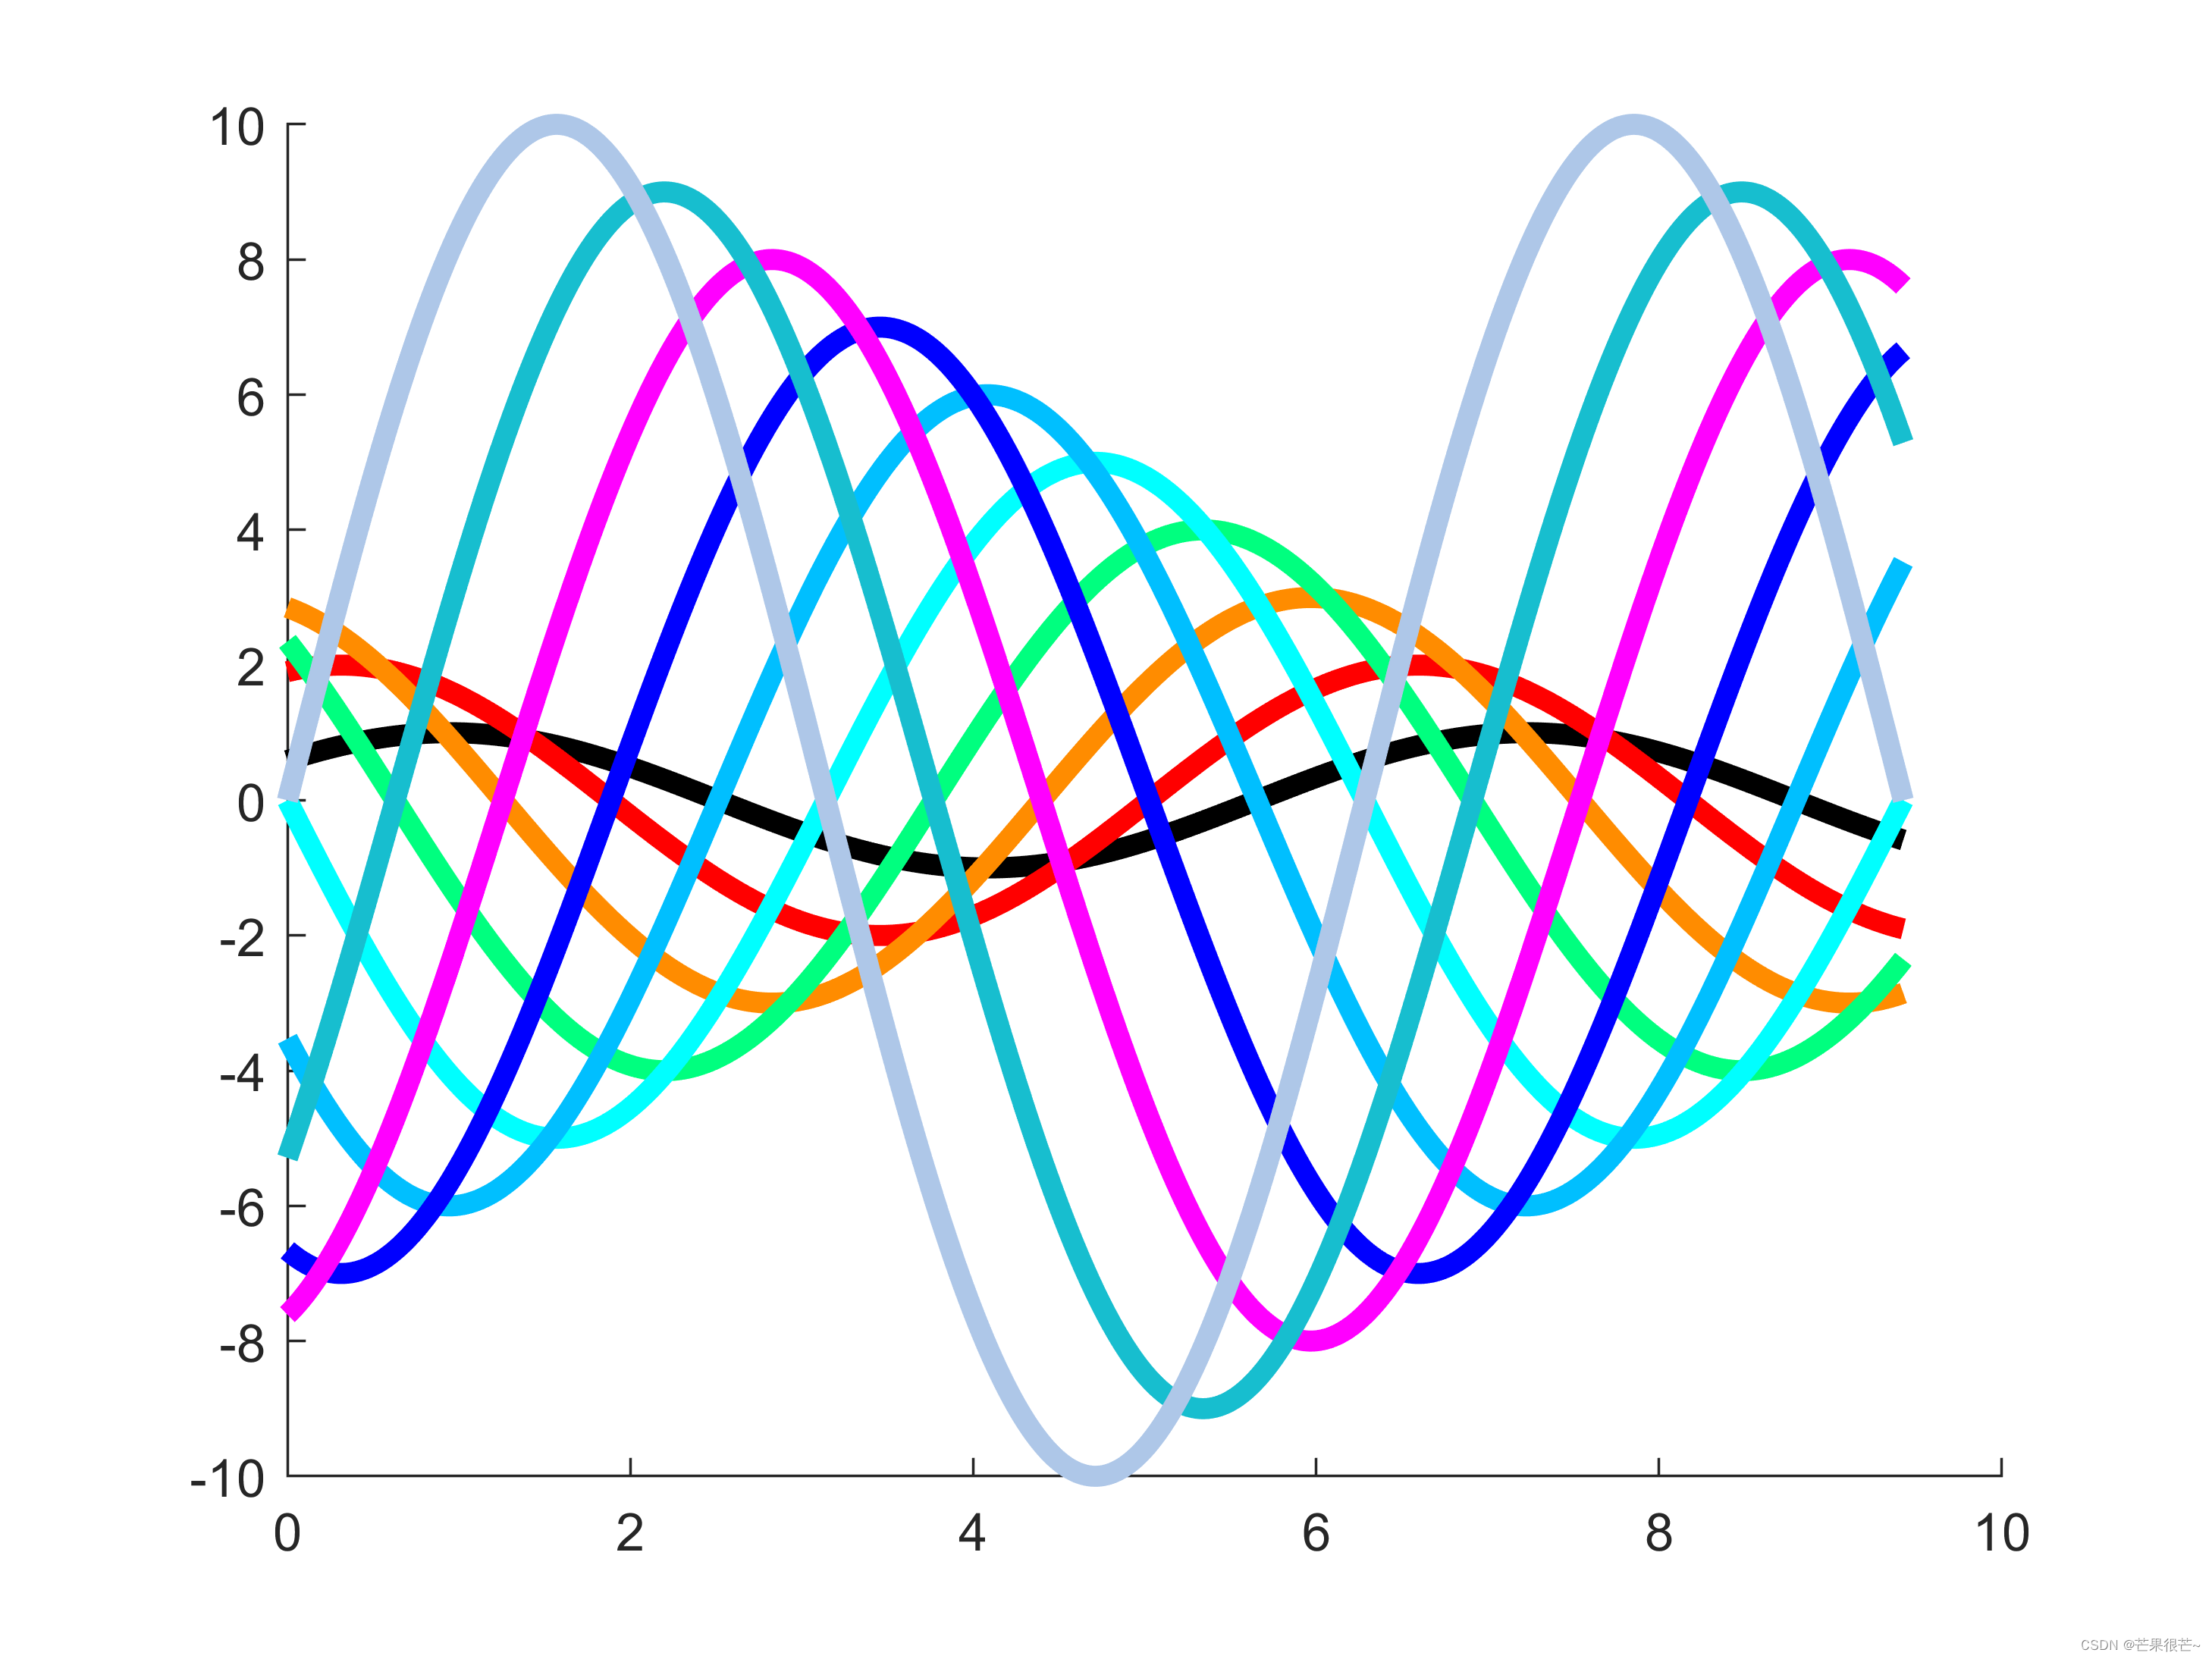
%% 多色,生成并保存一张包含多条正弦曲线的图像
N = 10; % 生成曲线数量/使用对比色数量
figure %创建一个新的图形窗口
axes('ColorOrder',addcolorplus([1,17,34,78,93,98,115,132,221:222]),'NextPlot','replacechildren') %参数 [1, 17, 34, 78, 93, 98, 115, 132, 221:222] 指定了要使用的颜色序列
X = linspace(0,pi*3,1000);
Y = bsxfun(@(x,n)n*sin(x+2*n*pi/N), X(:), 1:N);
plot(X,Y, 'linewidth',4)
print('test1.png','-dpng','-r500')
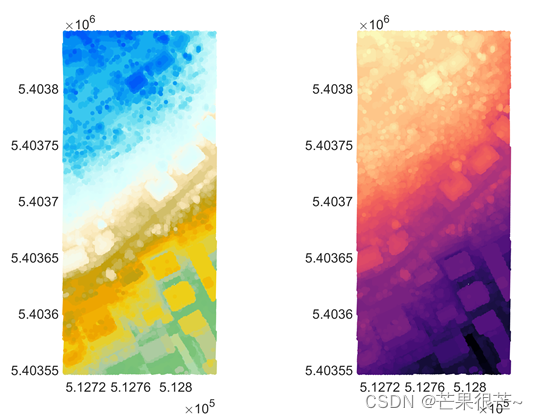
%% 渐变色
A = load('samp11.txt');
figure
scatter3(A(:,1),A(:,2),A(:,3),10,A(:,3),'filled') %分别表示散点的 x、y 和 z 坐标,10 表示散点的大小,A(:,3) 是散点的颜色数据,'filled' 表示填充散点。
colormap(addcolorplus(340))
axis equal %设置坐标轴比例相等,保证图像不会出现拉伸变形
view(0,90) %设置观察角度,这里是从正上方观察
print('test2.png','-dpng','-r500') %将绘制的图像保存为 PNG 格式的文件,文件名为 test2.png,分辨率为 500 DPI
figure
scatter3(A(:,1),A(:,2),A(:,3),10,A(:,3),'filled')
colormap(addcolorplus(303))
axis equal
view(0,90)
print('test3.png','-dpng','-r500')
%%%%%%%%%%%%%%%%%%%%%%%%%%
% 制作: 阿昆 %%%
% 公众号:阿昆的科研日常 %%%
%%%%%%%%%%%%%%%%%%%%%%%%%% 
网盘链接:
配色强化链接:https://pan.baidu.com/s/1_OEiMJTBM-Ua2I_yAwMvBA 提取码:rtj4
配色强化demo:链接:https://pan.baidu.com/s/1Tq6qANUgSO58skilQ99Plw 提取码:vpn2


 2461
2461

 被折叠的 条评论
为什么被折叠?
被折叠的 条评论
为什么被折叠?
 到【灌水乐园】发言


