


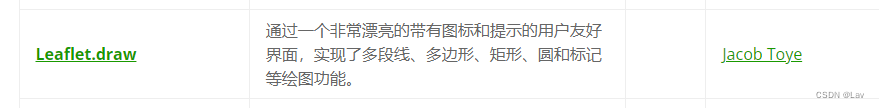
 本文详细介绍了如何在Vue应用中使用Leaflet的draw插件创建地图编辑器,包括安装、引入、创建编辑器和控件,以及绘制逻辑,特别提到了自定义marker和设置形状选项等。
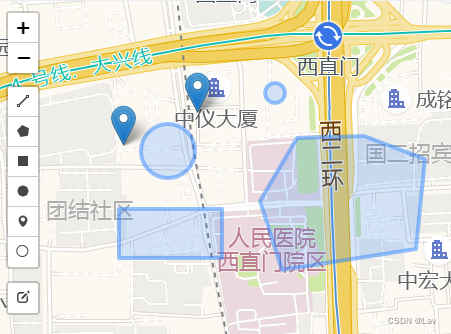
vue使用leaflet的draw插件绘制电子围栏
效果图
引入步骤
1 安装leaflet-draw插件
npm install leaflet-draw
2 在vue中引入插件
前提是已经安装好了leaflet,才能使用这些插件
// script里面导入插件
<script>
import 'leaflet-draw';
</script>

// 同时要引入插件样式
<style>
@import '~leaflet-draw/dist/leaflet.draw.css';      /*引入draw插件样式*/
</style>
3 创建编辑器和控件
var editableLayers  = new L.FeatureGroup();
console.log('编辑器:',editableLayers );
this.map.addLayer(editableLayers );

var drawControl = new L.Control.Draw({
	position: 'topleft',//控件位置 'topleft'(默认), 'topright', 'bottomleft' or 'bottomright'
    edit: {
         featureGroup: editableLayers ,
         remove: false
     },
});
console.log('控件:',drawControl)
this.map.addControl(drawControl);
5 绘制逻辑
this.map.on(L.Draw.Event.CREATED, function (e) {
     console.log('绘制ing',e)
     var latlngs = e.layer._latlngs   // arr [lat,lng] 一组经纬度,每个点都有

     console.log(latlngs)
     var type = e.layerType,
         layer = e.layer;
     if (type === 'marker') {
         layer.bindPopup('A popup!');
     }
     editableLayers.addLayer(layer);
 });
完整代码
import markerIcon from '@/assets/images/marker-icon.png';  // 导入的一张图片

// 编辑方法
drawEditor(){
    var MyCustomMarker = L.Icon.extend({
        options: {
            shadowUrl: null,
            iconAnchor: new L.Point(12, 12),
            iconSize: new L.Point(24, 24),
            iconUrl: markerIcon,
        }
    });
    var editableLayers  = new L.FeatureGroup();
    console.log('编辑器:',editableLayers );
    this.map.addLayer(editableLayers );
    var drawControl = new L.Control.Draw({
        position: 'topleft',//控件位置 'topleft'(默认), 'topright', 'bottomleft' or 'bottomright'
        edit: {
            featureGroup: editableLayers ,
            remove: false
        },
        polyline: {
            shapeOptions: {
                color: '#f357a1',
                weight: 10
            }
        },
        polygon: {
            allowIntersection: false, // Restricts shapes to simple polygons
            drawError: {
                color: 'red', // Color the shape will turn when intersects
                message: '<strong>Oh snap!<strong> you can\'t draw that!' // Message that will show when intersect
            },
            shapeOptions: {
                color: 'red'
            }
        },
        circle: false, // Turns off this drawing tool
        rectangle: {
            shapeOptions: {
                clickable: false
            }
        },
        marker: {
            icon: new MyCustomMarker()
        }
    });
    console.log('控件:',drawControl)
    this.map.addControl(drawControl);
    this.map.on(L.Draw.Event.CREATED, function (e) {
        console.log('绘制ing',e)
        var latlngs = e.layer._latlngs   // arr [lat,lng] 一组经纬度,每个点都有

        console.log(latlngs)
        var type = e.layerType,
            layer = e.layer;
        if (type === 'marker') {
            layer.bindPopup('A popup!');
        }
        editableLayers.addLayer(layer);
    });
}


 483
483

 被折叠的 条评论
为什么被折叠?
被折叠的 条评论
为什么被折叠?
 到【灌水乐园】发言


