统计小目标数量以及占比(分类别统计和总量统计)

脚本读取XML文件,计算对象面积,按比例划分小目标和超小目标,并输出各类别统计结果。

摘要生成于 C知道 ,由 DeepSeek-R1 满血版支持, 前往体验 >

概要

统计小目标数量以及占比,可以分类别统计。只需要一个xml即可输出统计。但是一般可能会有多个xml,就需要手动更改并汇总了。
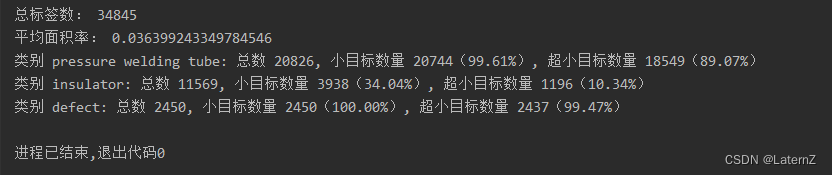
输出结果展示

在这里插入图片描述

代码

import os
import xml.etree.ElementTree as ET
from collections import defaultdict

def compute_small_object_percentage(path_annotations):
    small_threshold = 0.03  # 面积小于3%的视为小目标
    super_small_threshold = 0.01  # 面积小于1%的视为超小目标

    over_labels = 0
    total_area_ratio = 0.0

    class_small_labels = defaultdict(int)
    class_super_small_labels = defaultdict(int)
    class_total_labels = defaultdict(int)

    for xml_filename in os.listdir(path_annotations):
        xml_path = os.path.join(path_annotations, xml_filename)
        tree = ET.parse(xml_path)
        root = tree.getroot()

        image_width = int(root.find('size').find('width').text)
        image_height = int(root.find('size').find('height').text)
        image_area = image_width * image_height

        for obj in root.findall('object'):
            over_labels += 1
            bndbox = obj.find('bndbox')
            xmin = int(bndbox.find('xmin').text)
            ymin = int(bndbox.find('ymin').text)
            xmax = int(bndbox.find('xmax').text)
            ymax = int(bndbox.find('ymax').text)

            width = xmax - xmin
            height = ymax - ymin
            area = width * height

            area_ratio = area / image_area
            total_area_ratio += area_ratio

            label_name = obj.find('name').text

            if area_ratio < super_small_threshold:
                class_super_small_labels[label_name] += 1
                class_small_labels[label_name] += 1
            elif area_ratio < small_threshold:
                class_small_labels[label_name] += 1

            class_total_labels[label_name] += 1

    if over_labels > 0:
        average_area_ratio = total_area_ratio / over_labels
        print("总标签数:", over_labels)
        print("平均面积率:", average_area_ratio)

        # 打印每个类别的小目标和超小目标数量和比率
        for class_name in class_small_labels.keys():
            total_class_labels = class_total_labels[class_name]
            class_small_percentage = (class_small_labels[class_name] / total_class_labels) * 100
            class_super_small_percentage = (class_super_small_labels[class_name] / total_class_labels) * 100
            print(f"类别 {class_name}: 总数 {total_class_labels}, 小目标数量 {class_small_labels[class_name]}{class_small_percentage:.2f}%), 超小目标数量 {class_super_small_labels[class_name]}{class_super_small_percentage:.2f}%)")
    else:
        print("没有找到标签文件。")

def main():
    path_annotations = r"D:\YOLO\Annotations"# 请将路径更改为您的XML文件所在的目录
    compute_small_object_percentage(path_annotations)

if __name__ == '__main__':
    main()

对于这份顾客购物信息的数据集,我们可以从以下几个方面对其进行探索析,并通过统计特征函数、绘图等方式展示结果。以下是具体的步骤及初步情况说明: --- ### **1. 数据预处理** 在开始数据析之前,需要对数据进行清洗检查,包括但不限于: - 检查是否有缺失值(`null` 或 `NaN`),并决定如何处理它们(例如删除或填充)。 - 确认各列的数据类型是否正确(如将日期字符串转换为日期时间格式)。 - 对异常值进行检测处理(如负数商品数量、不合理的价格等)。 #### 初步观察: ```python import pandas as pd # 加载数据 data = pd.read_csv('shopping_data.csv') # 查看基本信息 print(data.info()) print(data.describe()) # 检查缺失值 missing_values = data.isnull().sum() ``` --- ### **2. 统计描述** #### (1) 交易总量与收入总额 计算总的交易笔数以及总收入金额: ```python total_transactions = len(data) total_revenue = data['price'].sum() print(f"总交易量: {total_transactions}") print(f"总收入金额: {total_revenue:.2f} 元") ``` #### (2)类别销售占比 按商品类别 (`category`) 计算销售额的比例: ```python category_sales = data.groupby('category')['price'].sum().sort_values(ascending=False) # 可视化柱状图 import matplotlib.pyplot as plt plt.figure(figsize=(10,6)) category_sales.plot(kind='bar', color='skyblue') plt.title("各类别销售总额对比") plt.xlabel("商品类别") plt.ylabel("销售额(元)") plt.show() ``` **结论**: 哪些类别的商品更受欢迎? --- ### **3. 时间序列析** #### (1) 日均交易趋势 按照日期查看每日交易额变化: ```python daily_sales = data.groupby(pd.to_datetime(data['invoice_date']).dt.date)['price'].sum() # 绘制折线图 plt.figure(figsize=(12,6)) plt.plot(daily_sales.index, daily_sales.values, marker='o', linestyle='-') plt.title("日均销售额趋势") plt.xlabel("日期") plt.ylabel("销售额(元)") plt.xticks(rotation=45) plt.grid(True) plt.tight_layout() plt.show() ``` **结论**: 是否存在明显的季节性波动?哪几天销售额最高? #### (2) 小时级布 如果发票时间包含小时字段,则可以进一步析一天内何时消费者活动最活跃。 --- ### **4. 客户群体析** #### (1) 性别比例 比较男女消费差异: ```python gender_distribution = data['gender'].value_counts(normalize=True).mul(100).round(2) # 饼图可视化 plt.pie(gender_distribution, labels=gender_distribution.index, autopct='%1.1f%%', startangle=90) plt.title("性别比例布") plt.axis('equal') plt.show() ``` **结论**: 谁是主力消费人群? #### (2) 年龄段划 根据年龄段切片了解不同年龄层消费者的偏好: ```python bins = [0, 18, 25, 35, 50, float('inf')] labels = ['<18岁', '18-25岁', '26-35岁', '36-50岁', '>50岁'] data['age_group'] = pd.cut(data['age'], bins=bins, labels=labels) age_group_spending = data.groupby('age_group')['price'].mean().sort_values(ascending=False) # 条形图 plt.bar(age_group_spending.index, age_group_spending.values, color='orange') plt.title("平均消费能力随年龄段的变化") plt.xlabel("年龄段") plt.ylabel("人均支出(元)") plt.show() ``` **结论**: 哪个年龄段的人群愿意花费更多金钱? --- ### **5. 支付方式偏爱度** 析哪些支付方式最受欢迎: ```python payment_preference = data['payment_method'].value_counts(normalize=True).mul(100).round(2) # 饼图表示 plt.pie(payment_preference, labels=payment_preference.index, autopct='%1.1f%%', startangle=90) plt.title("支付方式使用频率") plt.axis('equal') plt.show() ``` **结论**: 用户最喜欢哪种付款工具? --- ### **6. 单次消费水平布** 研究单张发票的平均消费额度及其范围: ```python avg_per_invoice = data.groupby('invoice_no')['price'].sum().mean() # 直方图显示价格区间 plt.hist(data['price'], bins=30, edgecolor='black', alpha=0.7) plt.title("单次消费金额布直方图") plt.xlabel("消费金额(元)") plt.ylabel("频次") plt.axvline(avg_per_invoice, color='r', linestyle='dashed', linewidth=2, label=f'平均={avg_per_invoice:.2f}') plt.legend() plt.show() ``` **结论**: 多少属于正常范围内?是否存在极端高价值订单? --- ### **总结** 通过对上述各项指标的综合评估,我们能够得出关于目标用户行为模式的关键洞察,并为企业制定营销策略提供依据。比如针对特定品类增加促销力度;优化某些时段服务流程提升效率等等。 最终成果需整理成 Jupyter Notebook 文件上传作为附件提交! ---
评论 1
添加红包

请填写红包祝福语或标题

红包个数最小为10个

红包金额最低5元

当前余额3.43前往充值 >
需支付:10.00
成就一亿技术人!
领取后你会自动成为博主和红包主的粉丝 规则
hope_wisdom
发出的红包
实付
使用余额支付
点击重新获取
扫码支付
钱包余额 0

抵扣说明:

1.余额是钱包充值的虚拟货币,按照1:1的比例进行支付金额的抵扣。
2.余额无法直接购买下载,可以购买VIP、付费专栏及课程。

余额充值