


这只是一个简单的例子啦~
需要给曲线绘制不同颜色进行区分,如下图所示:
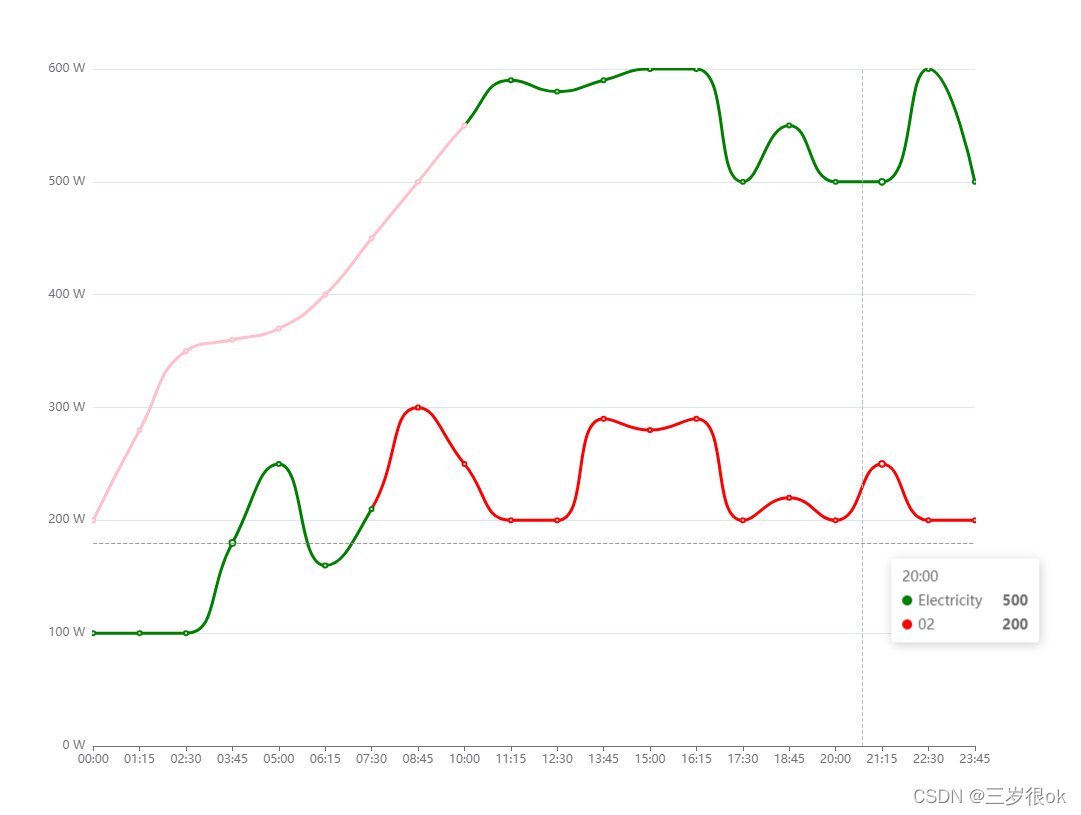
关键点:visualMap
option = {
  title: {
    text: '简单是一个示例', //标题
    subtext: '变变变色!'
  },
  tooltip: {
    trigger: 'axis',		//显示轴
    axisPointer: {
      type: 'cross'
    }
  },
  toolbox: {			//工具栏
    show: true,
    feature: {
      saveAsImage: {}
    }
  },
  xAxis: {
    type: 'category',		//x轴
    boundaryGap: false,
    data: ['00:00', '01:15', '02:30', '03:45', '05:00', '06:15', '07:30', '08:45', '10:00', '11:15', '12:30', '13:45', '15:00', '16:15', '17:30', '18:45', '20:00', '21:15', '22:30', '23:45']
  },
  yAxis: {
    type: 'value',			//y轴
    axisLabel: {
      formatter: '{value} W'		//y轴坐标文字样式
    },
    axisPointer: {
      snap: true
    }
  },
  visualMap: [{
    show: true,
    dimension: 0,
    seriesIndex:1,   //第二条曲线
    pieces: [
      {
        lte: 6,
        color: 'green'     //前部分颜色
      },
      {
        gt: 6,
        lte: 100,
        color: 'red',
      }
    ]
  },{
    show: true,
    dimension: 0,
    seriesIndex:0,
    pieces: [
      {
        lte: 8,
        color: 'pink'
      },
      {
        gt: 8,
        lte: 100,
        color: 'green'
      }
    ]
  }],
  series: [
    {
      name: '01',
      type: 'line',
      smooth: true,
      data: [200, 280, 350, 360, 370, 400, 450, 500, 550, 590, 580, 590,600, 600, 500, 550, 500, 500, 600, 500],
      markArea: {
        itemStyle: {
          color: 'rgba(255, 173, 177, 0.4)'
        },
      }
    },
     {
      name: '02',
      type: 'line',
      smooth: true,
      data: [100,100,100, 180, 250, 160, 210, 300, 250, 200, 200, 290, 280, 290, 200, 220, 200, 250, 200, 200, 200, 300],
      markArea: {
        itemStyle: {
          color: 'rgba(255, 173, 177, 0.4)'
        },
      }
    }
  ]
};


 9912
9912

 被折叠的 条评论
为什么被折叠?
被折叠的 条评论
为什么被折叠?
 到【灌水乐园】发言


