


 这篇博客介绍了MATLAB的基础绘图,包括1.10页的作业,涉及矩阵求幂和图例设置;21页的Marker specification作业,强调了各种图形属性如颜色、形状和大小的设置;22页的作业2,关注线条宽度和标记颜色;同时讲解了如何创建多个figure及 subplot 命令的使用,以及网格和坐标轴的控制。
matlab basic plotting
1.10页的基础绘图第一次作业代码:
t=1:0.01:2;
f1=t.^2;
g1=sin(2*pi*t);
plot(t,f1,'k-',t,g1,'ro');
xlabel('Time (ms)');
ylabel('f(t)');
title('Mini Assignment #1');
legend('t^2','sin(2\pit)','Location','northwest')

这个例子中需要注意的点在于:
- 求幂时需要记住用点(. ^ ),否则会报错:用于对矩阵求幂的维度不正确。请检查并确保矩阵为方阵并且幂为标量。要执行按元素矩阵求幂,请使用 ‘.^’。
- label不要拼错了
- legend里想要显示出2πt,记得pi要用:\pi 进行转义,否则不会显示你想要的的π,同时location是表示图例放置的位置。
2. 21页的Marker specification作业
要求:横坐标0 to 20,纵坐标0 to 1 的随机函数,坐标轴的fontsize大小为18,曲线为实线,颜色为M,线宽为2,点的形状为菱形(d),点的eddgecolor 为黑色,facecolor 为绿色, size为10。调整横坐标区间为1 to 20
x=rand(20,1);
set(gca,'Fontsize',18);
plot(x,'-md','linewidth',2,'markeredgecolor','k','markerfacecolor','g','markersize',10);
set(gca,'xlim',[1,20])

本题命令需要注意的是:
- 在调整关于大小的命令,如:坐标轴的大小,fontsize,线宽,linwidth,点的大小,markersize等后接具体数值时都不需要加单引号。
- edge单词别拼错了。
- set(gca,’’)命令。
3. 22页的基础绘图作业2
要求:fontsize:18,线宽改为2,marekerfacecolor:pink
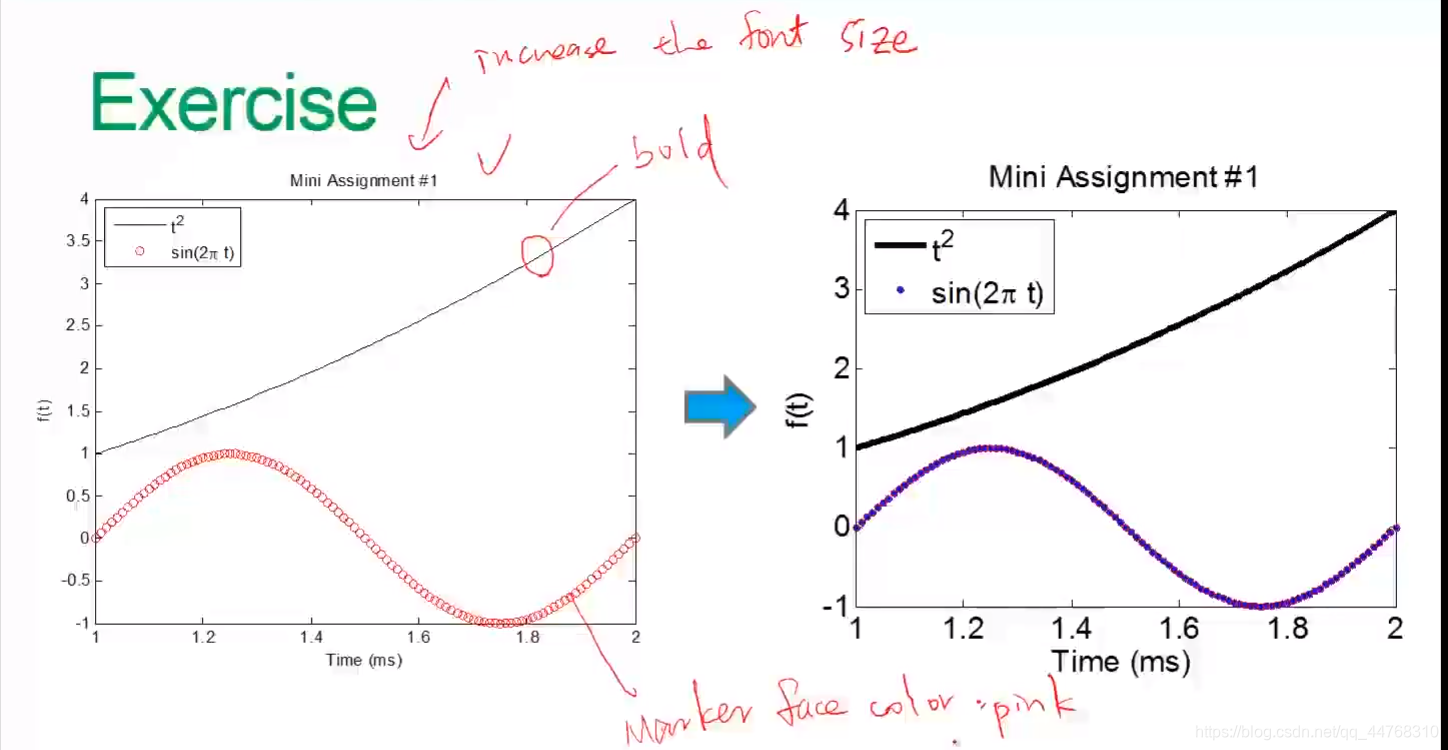
代码如下:
t=linspace(1,2,200);
f1=t.^2;
g1=sin(2*pi*t);
plot(t,f1,'k-',t,g1,'ro','linewidth',2,'markeredgecolor','b','markerfacecolor','m');
xlabel('Time (ms)');
ylabel('f(t)');
title('Mini Assignment #1');
legend('t^2','sin(2\pit)','Location','northwest')
set(gca,'fontsize',18);
4. 想要产生不同的figure(即产生多张figure)
则需要利用figure命令。
举例:
x = -10:0.1:10;
y1 = x.^2 - 8;
y2 = exp(x);
figure, plot(x,y1);
figure, plot(x,y2);
5. 多张figure共存于一个画布上的命令
需要用到subplot命令
subplot(m,n,x);
其中的m代表row(行数),n代表column(列数),后面的x则取1 to m×n中的任一数。
举例:
t = 0:0.1:2*pi; x = 3*cos(t); y = sin(t);
subplot(2, 2, 1); plot(x, y); axis normal
subplot(2, 2, 2); plot(x, y); axis square
subplot(2, 2, 3); plot(x, y); axis equal
subplot(2, 2, 4); plot(x, y); axis equal tight
6. 一些对网格,坐标轴控制的命令
1 grid on/off 网格打开和关闭
2 box on/off 打开和关闭上方和右方的坐标轴
3 axis on/off 打开关闭坐标轴
4 axis square 产生正方形坐标系
5 axis equal 纵横轴采用等长刻度(即它的tick是相等的)
6 axis equal tight: Set the axis limits to the range of the data
7 axis equal image: Let the plot box fits tightly around the data
8 axis ij: Place the origin of the coordinate system in the
upper left corner
9 axis xy: Place the origin in the lower left corner


 3万+
3万+

 被折叠的 条评论
为什么被折叠?
被折叠的 条评论
为什么被折叠?
 到【灌水乐园】发言


