


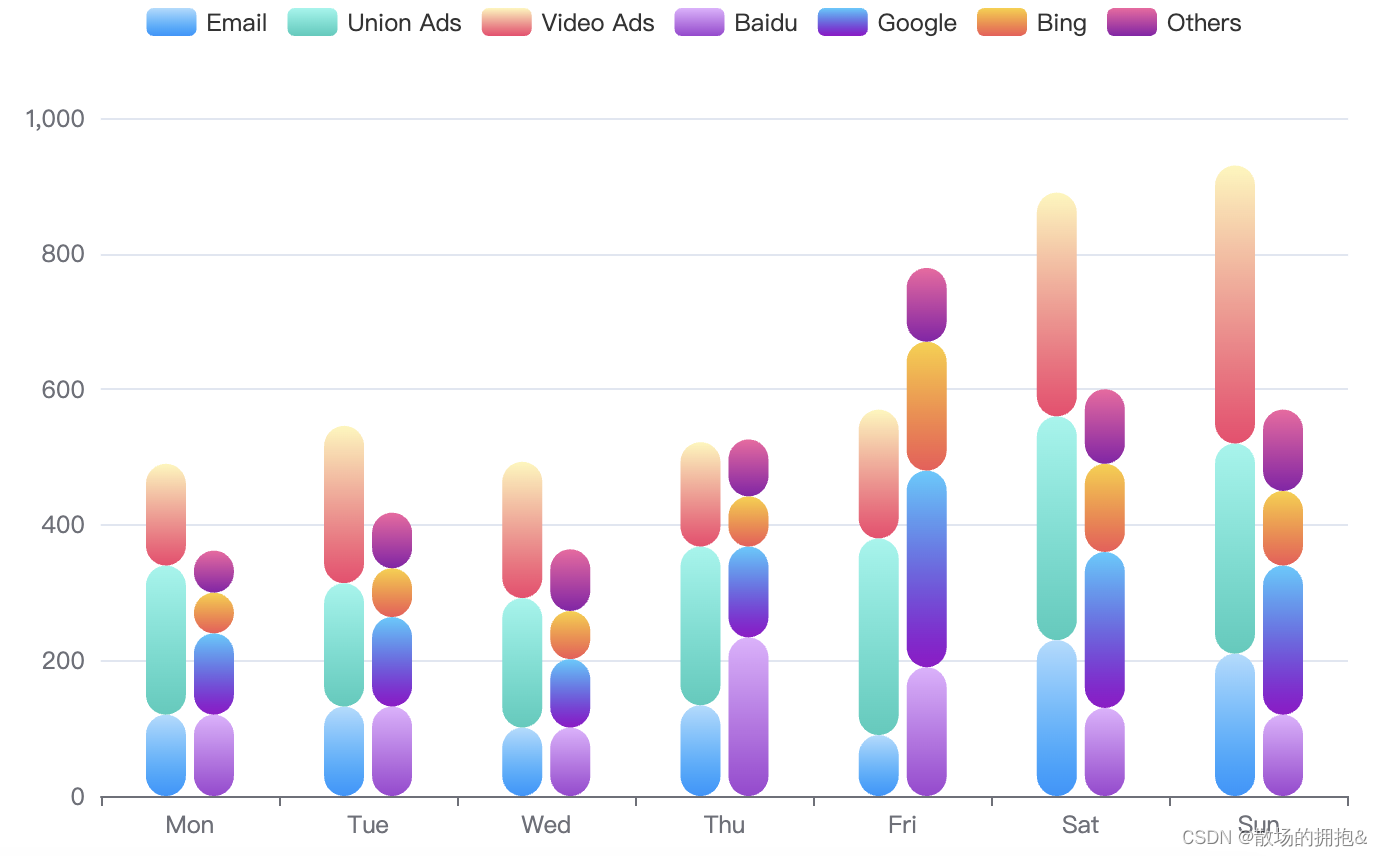
一、效果图如下:
二、代码配置如下
结构:
(1)父组件
<template>
  <div class="page-con">
    <div class="main-con">
      <item></item>
    </div>
  </div>
</template>

<script>
import item from '../bigdata/components/item.vue'
export default {
  components: {
    item
  }
}
</script>

<style lang="scss" scoped>
.page-con {
  width: 100%;
  height: 100%;
  .main-con {
    width: 40%;
    height: 33%;
  }
}
</style>
(2)子组件
<template>
  <div class="bar">
    <div ref="volumn" class="volume" />
  </div>
</template>

<script>
import echarts from "echarts";
export default {
  data() {
    return {
      myChart: null,
    };
  },
  mounted() {
    // 获取数据。
    if (this.$refs.volumn) {
      this.reloadChart();
      // 自适应浏览器。
      window.addEventListener("resize", () => {
        this.reloadChart();
      });
    }
  },
  // 组件销毁。
  beforeDestroy() {
    this.disposeChart();
  },
  methods: {
    drawChart() {
      this.myChart = this.$echarts.init(this.$refs.volumn);
      // 绘制图表
      const basicColors = [
        ["#ABDCFF", "#0396FF"],
        ["#90F7EC", "#32CCBC"],
        ["#FFF6B7", "#F6416C"],
        ["#E2B0FF", "#9F44D3"],
        ["#43CBFF", "#9708CC"],
        ["#FCCF31", "#F55555"],
        ["#F761A1", "#8C1BAB"],
        ["#81FBB8", "#28C76F"],
      ];
      // 生成渐变色
      function genLinearGradient(colors) {
        let color = {
          type: "linear",
          x: 0,
          y: 0,
          x2: 0,
          y2: 1,
          colorStops: [
            {
              offset: 0,
              color: colors[0], // 0%处的颜色
            },
            {
              offset: 1,
              color: colors[1], // 100%处的颜色
            },
          ],
          global: false,
        };
        return color;
      }
      var option = {
        tooltip: {
          trigger: "axis",
          axisPointer: {
            type: "shadow",
          },
        },
        legend: {},
        grid: {
          left: "3%",
          right: "4%",
          bottom: "3%",
          containLabel: true,
        },
        xAxis: [
          {
            type: "category",
            data: ["Mon", "Tue", "Wed", "Thu", "Fri", "Sat", "Sun"],
          },
        ],
        yAxis: [
          {
            type: "value",
          },
        ],
        series: [
          {
            name: "Email",
            type: "bar",
            stack: "Ad",
            barWidth: 20,
            data: [120, 132, 101, 134, 90, 230, 210],
            itemStyle: {
              color: genLinearGradient(basicColors[0]),
              barBorderRadius: 10,
            },
          },
          {
            name: "Union Ads",
            type: "bar",
            stack: "Ad",
            barWidth: 20,
            data: [220, 182, 191, 234, 290, 330, 310],
            itemStyle: {
              color: genLinearGradient(basicColors[1]),
              barBorderRadius: 10,
            },
          },
          {
            name: "Video Ads",
            type: "bar",
            stack: "Ad",
            barWidth: 20,
            data: [150, 232, 201, 154, 190, 330, 410],
            itemStyle: {
              color: genLinearGradient(basicColors[2]),
              barBorderRadius: 10,
            },
          },
          {
            name: "Baidu",
            type: "bar",
            barWidth: 20,
            stack: "Search Engine",
            data: [120, 132, 101, 234, 190, 130, 120],
            itemStyle: {
              color: genLinearGradient(basicColors[3]),
              barBorderRadius: 10,
            },
          },
          {
            name: "Google",
            type: "bar",
            stack: "Search Engine",
            data: [120, 132, 101, 134, 290, 230, 220],
            itemStyle: {
              color: genLinearGradient(basicColors[4]),
              barBorderRadius: 10,
            },
          },
          {
            name: "Bing",
            type: "bar",
            stack: "Search Engine",
            data: [60, 72, 71, 74, 190, 130, 110],
            itemStyle: {
              color: genLinearGradient(basicColors[5]),
              barBorderRadius: 10,
            },
          },
          {
            name: "Others",
            type: "bar",
            stack: "Search Engine",
            data: [62, 82, 91, 84, 109, 110, 120],
            itemStyle: {
              color: genLinearGradient(basicColors[6]),
              barBorderRadius: 10,
            },
          },
        ],
      };
      this.myChart.setOption(option);
    },
    // 字体自适应。
    fontSize(res) {
      const clientWidth =
        window.innerWidth ||
        document.documentElement.clientWidth ||
        document.body.clientWidth;
      if (!clientWidth) return;
      const fontSize = 40 * (clientWidth / 1920);
      return res * fontSize;
    },
    // 销毁图表。
    disposeChart() {
      if (this.myChart) {
        this.myChart.dispose();
      }
    },
    // 重新加载图表。
    reloadChart() {
      this.disposeChart();
      this.drawChart();
    },
  },
};
</script>

<style lang="scss" scoped>
.bar {
  width: 100%;
  height: 100%;
  .volume {
    width: 100%;
    height: 100%;
  }
}
</style>


 2540
2540

 被折叠的 条评论
为什么被折叠?
被折叠的 条评论
为什么被折叠?
 到【灌水乐园】发言


