


系列文章目录
openGauss数据库告警机制介绍
openGauss告警检测机制-慢盘检测
前言
操作系统的性能和稳定性是数据库高效运行及用户体验的关键保障,而CPU负载作为衡量系统健康的核心指标,其监控与预警尤为重要。openGauss数据库提供了CPU负载检测与实时告警机制,为用户提供了快速识别并响应系统异常的能力。
一、原理
在 Linux 系统中,/proc/stat 是一个虚拟文件,位于 /proc 文件系统下,用于提供系统自启动以来的各项统计信息,包括 CPU 使用时间、上下文切换次数、中断数量、启动进程数等。由于 /proc 是内存中的伪文件系统,/proc/stat 不占用外存空间,而是动态反映系统的运行状态 。
运行cat /proc/stat命令后,可以看到如下输出:
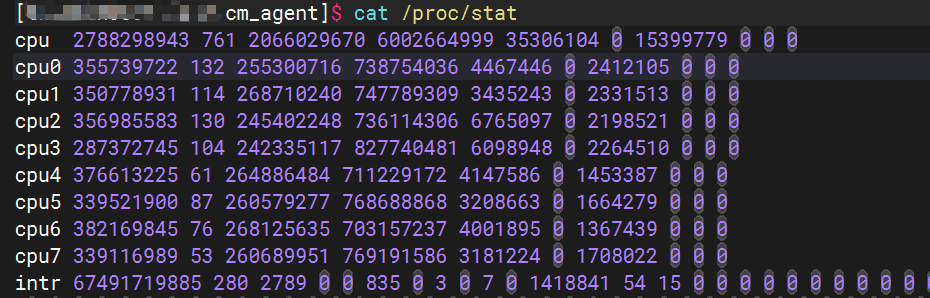
各列的含义如下,其中首行为所有CPU对应列值的总和
| 字段 | 描述 |
|---|---|
| user | 用户态时间(非特权进程) |
| nice | 用户态时间(低优先级进程) |
| system | 内核态时间 |
| idle | 空闲时间 |
| iowait | I/O 等待时间 |
| irq | 硬中断时间 |
| softirq | 软中断时间 |
| steal | 虚拟化环境下被其他 OS 占用的时间 |
| guest | 运行虚拟 CPU 的时间 |
| guest_nice | 低优先级虚拟 CPU 时间 |
通过读取 /proc/stat 中 CPU 时间的变化,可计算任意时间间隔内的 CPU 利用率。
第一次采样:
- total1 = ((user1 + nice1 + system1 + idle1 + iowait1 + irq1 + softirq1 + steal1 + guest1 + guest_nice1))
- idle_total1 = idle1
第二次采样:
- total2 = ((user2 + nice2 + system2 + idle2 + iowait2 + irq2 + softirq2 + steal2 + guest2 + guest_nice2))
- idle_total2 = idle2
CPU利用率计算
cpuUtil = ((total2 - total1) - (idle_total1 - idle_total2)) / (total2 - total1)
二、检测方法
1、每隔1秒,通过sscanf_s函数扫描出所有CPU各个列值的和,累加计算cpuTotalTime。
status_t SetCpuStatInfo(const char* line, CpuSimpleInfo* cpuSimpleInfo) {
    const int cpuNameLen = 8;
    const int cpuInfoCount = 11;
    char cpuName[cpuNameLen] = {0};
    CpuInfo* tmpCpuInfo = &(cpuSimpleInfo->cpuInfo);
    errno_t rc = sscanf_s(line, "%s %lu %lu %lu %lu %lu %lu %lu %lu %lu %lu", cpuName, cpuNameLen,
        &tmpCpuInfo->cpuUser, &tmpCpuInfo->cpuNice, &tmpCpuInfo->cpuSys, &tmpCpuInfo->cpuIdle, &tmpCpuInfo->cpuIwait,
        &tmpCpuInfo->cpuHardirq, &tmpCpuInfo->cpuSoftirq, &tmpCpuInfo->cpuSteal, &tmpCpuInfo->cpuGuest,
        &tmpCpuInfo->cpuGuestNice);
    check_sscanf_s_result(rc, cpuInfoCount);
    if (rc != cpuInfoCount) {
        write_runlog(ERROR, "get cpu info from %s failed, line %s, count %d.\n", FILE_CPUSTAT, line, rc);
        return CM_ERROR;
    }

    cpuSimpleInfo->cpuIdleTime = tmpCpuInfo->cpuIdle;
    cpuSimpleInfo->cpuUserTime = tmpCpuInfo->cpuUser;
    cpuSimpleInfo->cpuSystemTime = tmpCpuInfo->cpuSys;
    cpuSimpleInfo->cpuTotalTime = 0;
    uint64* value = (uint64*)tmpCpuInfo;
    uint32 len = (uint32)sizeof(CpuInfo) / sizeof(uint64);
    for (uint32 i = 0; i < len; ++i) {
        cpuSimpleInfo->cpuTotalTime += *(value++);
    }
    return (strcmp(cpuName, "cpu") == 0) ? CM_SUCCESS : CM_ERROR;
}
2、将当前采集的数据与上一次采集到的数据相减得到两次采样之间CPU的使用时间,除以总时间可计算得到CPU利用率
status_t CheckCpuStatus(CpuStatInfo* cpuStatInfo) {
    CpuSimpleInfo curCpuInfo = {0};
    char line[MAX_PATH_LEN] = {0};
    FILE* fp = fopen(FILE_CPUSTAT, "re");
    if (fp == NULL) {
        write_runlog(ERROR, "failed to open file %s.\n", FILE_CPUSTAT);
        return CM_ERROR;
    }
    while (fgets(line, sizeof(line), fp)!= NULL) {
        if (SetCpuStatInfo(line, &curCpuInfo)!= CM_SUCCESS) {
            write_runlog(ERROR, "failed to set cpu stat info, line=[%s].\n", line);
            FCLOSE_AND_RESET(fp);
            return CM_ERROR;
        }
        break;
    }
    fclose(fp);
    if (cpuStatInfo->oldCpuInfo.cpuTotalTime != 0) {
        uint64* oldValue = (uint64*) &(cpuStatInfo->oldCpuInfo);
        uint64* curValue = (uint64*) &(curCpuInfo);
        uint32 count = (uint32)sizeof(CpuSimpleInfo) / sizeof(uint64);
        for (uint32 i = 0; i < count; ++i) {
            if (*(curValue++) < *(oldValue++)) {
                write_runlog(ERROR, "get cpu info wrong, curCpuTime(%lu) < oldCpuTime(%lu). and index=[%u]\n",
                    *(curValue--), *(oldValue--), i);
                errno_t rc = memcpy_s(&(cpuStatInfo->oldCpuInfo), sizeof(CpuSimpleInfo), &(curCpuInfo), sizeof(CpuSimpleInfo));
                securec_check_errno(rc, (void)  rc);
                return CM_ERROR;
            }
        }
        uint64 totalTimeInterval = curCpuInfo.cpuTotalTime - cpuStatInfo->oldCpuInfo.cpuTotalTime;
        uint64 sysTimeInterval = curCpuInfo.cpuSystemTime - cpuStatInfo->oldCpuInfo.cpuSystemTime;
        uint64 userTimeInterval = curCpuInfo.cpuUserTime - cpuStatInfo->oldCpuInfo.cpuUserTime;
        uint64 idleTimeInterval = curCpuInfo.cpuIdleTime - cpuStatInfo->oldCpuInfo.cpuIdleTime;
        cpuStatInfo->cpuUtil = (float)(totalTimeInterval - idleTimeInterval) / (float)totalTimeInterval * PERCENT;
        cpuStatInfo->cpuSystemUtil = (float)sysTimeInterval / (float)totalTimeInterval * PERCENT;
        cpuStatInfo->cpuUserUtil = (float)userTimeInterval / (float)totalTimeInterval * PERCENT;
    }
    errno_t rc = memcpy_s(&(cpuStatInfo->oldCpuInfo), sizeof(CpuSimpleInfo), &(curCpuInfo), sizeof(CpuSimpleInfo));
    securec_check_errno(rc, (void)  rc);
    return CM_SUCCESS;
}
3、如果CPU使用率超出指定的阈值,则产生一次告警
void ReportSystemStatusAlarm(const SystemStatInfo* systemStat, const EnvThreshold* threshold) {
    int cpuUsed = (int)systemStat->cpuStatInfo.cpuUtil;
    if (threshold->cpu > 0 && cpuUsed > threshold->cpu) {
        write_runlog(LOG, "system cpu usage is %u, threshold is %u, report alarm.\n", cpuUsed, threshold->cpu);
        ReportCpuAbnormalAlarm(cpuUsed, threshold->cpu);
    }
    .......
}


 1352
1352

 被折叠的 条评论
为什么被折叠?
被折叠的 条评论
为什么被折叠?
 到【灌水乐园】发言


