


在一家互联网企业工作,工作接近一年,总结一下对openlayers的学习,主要是在vue项目中对openlayers的使用,希望可以对大家有所帮助~~
从openlayers的安装说起把~
npm install olopenlayers在项目中的引入
引入是按需引入,根据你所需要的来引入就好了
import 'ol/ol.css'
import Map from 'ol/Map'
import View from 'ol/View'
import { WMTS, Vector as VectorSource } from 'ol/source'
import { Tile as TileLayer, Vector as VectorLayer } from 'ol/layer'
import { Circle as CircleStyle, Fill, Stroke, Icon, Text, Style } from 'ol/style';
import WMTSTileGrid from 'ol/tilegrid/WMTS'
import Feature from 'ol/Feature'
import { XYZ,ImageWMS,TileWMS, Vector as VectorSource,WMTS } from "ol/source";
import { Tile as TileLayer, Image as ImageLayer,Vector as VectorLayer } from "ol/layer";
创建天地图
为了方便后面对地图的操作,可以将map定义成全局变量
data(){
  return{
    map:null,
    newcontent: null,
    newoverlay: null,
  }
},
mounted(){
  this.initMap()
},
methods:{
  initMap(){
    const map = new Map({
        target: 'map',
        // logo: false,
        layers: [],
        view: new View({
          // 地图视图
          projection: 'EPSG:4326', // 坐标系,有EPSG:4326和EPSG:3857
          center: [117.2531, 31.861184], // 坐标 安徽
          // minZoom: 10, // 地图缩放最小级别
          zoom: 8 // 地图缩放级别
        })
    })
    this.map = map
    const wkid = "EPSG:4326"
    //天地图底图
    this.addTiandiLayer("http://t{0-7}.tianditu.com/DataServer?T=vec_w&tk=申请的天地图
    key&x= {x}&y={y}&l={z}",wkid)
    //天地图标注图层
    this.addTiandiLayer("'http://t{0-7}.tianditu.com/DataServer?T=cva_w&tk=申请的天地图
    key&x= {x}&y={y}&l={z}'",wkid)
  },
   addTiandiLayer(url,wkid) {
     const source = new XYZ({
       url: url,
       projection: wkid
     });
     const tdtLayer = new TileLayer({
       source: source,
       visible: true
     });
  }
}
加载wms图层
addWMSLayer (url, layerId, id) {
      debugger
      const wmsLayer = new TileLayer({
        source: new TileWMS({
          url: url,
          params: {
            LAYERS: layerId,
            TILED: true,
            serverType: "geoserver",
          },
        }),
      });
      wmsLayer.set('id', id)
      this.map.addLayer(wmsLayer);
    }
加载wmts图层
function addWMTSLayer(url,type){
        var layer = null
        fetch(url, { mode: 'cors' }).then(function (response) {
          return response.text()
        }).then((text) => {
          const parser = new ol.format.WMTSCapabilities()
          const result = parser.read(text)
          const options = ol.source.WMTS.optionsFromCapabilities(result, {
            layer: result['Contents']['Layer'][0].Identifier,
            matrixSet: result['Contents']['TileMatrixSet'][0].Identifier,
            projection: projection
          })
          /**兼容不同引擎切图原点YX, XY */
          // const origins = options.tileGrid.origins_
          // let neworigins = origins.map(origin => {
          //   if (origin[0] > origin[1]) {
          //     return [origin[1], origin[0]]
          //   } else {
          //     return [origin[0], origin[1]]
          //   }
          // })
          // options.tileGrid.origins_ = neworigins
          layer = new ol.layer.Tile({
            source: new ol.source.WMTS((options)),
            visible: true
          })
          layer.set('id', '1111')
          map.addLayer(layer)
        })
      }
加载ArcgisRestTileLayer
addArcgisRestTileLayer (url, id) {
      const result = await this.$http.get(url + "?f=json")
      const data = result.data;
      let source = null;
      if (data.tileInfo) {
        const urlTemplate = url + '/tile/{z}/{y}/{x}';
        const tileInfo = data.tileInfo;
        const lods = tileInfo.lods.length
        let resolutions = new Array(lods);
        let matrixIds = new Array(lods);
        for (var z = 0; z < lods; ++z) {
          resolutions[z] = tileInfo.lods[z].resolution;
          matrixIds[z] = z;
        }
        const tileGrid = new TileGrid({
          origin: [tileInfo.origin.x, tileInfo.origin.y], //原点(左上角)
          resolutions: resolutions, //分辨率数组
          matrixIds: matrixIds //矩阵标识列表,与地图级数保持一致
        });
        source = new XYZ({
          maxZoom: lods,
          tileSize: tileInfo.cols,
          projection: this.projCode,
          tileGrid: tileGrid,
          tilePixelRatio: 2,
          tileUrlFunction: function (tileCoord) {
            let z = tileCoord[0];
            if (tileInfo.cols === 512) {
              z = tileCoord[0] + 1
            }
            return urlTemplate.replace('{z}', z.toString())
              .replace('{x}', tileCoord[1].toString())
              .replace('{y}', (-tileCoord[2] - 1).toString());
          },
        })
      } else {
        source = new TileArcGISRest({
          url: url + '/export'
        });
      }
      const arcgisLayer = new TileLayer({
        source: source
      })
      arcgisLayer.set('id', id)
      this.map.addLayer(arcgisLayer);
    }
加载矢量数据
以点为例,point.setProperties(data[i]);很重要,不写的话点击的时候获取不到point的属性数据
addPointData(){
  var source = new VectorSource();
  var layer = new VectorLayer({
      source: source
  });
  this.map.addLayer(layer);
  for (let i = 0; i < data.length; i++) {
    const point = new Feature({
      geometry: new Point([data[i].longitude, data[i].latitude])
    });
    point.setStyle(new Style({
      image: new Icon({
        src: require('../../../assets/icons/点.png')
      })
    }))
    point.setProperties(data[i]);//这点很重要,不写的话点击的时候获取不到point的属性数据
    source.addFeature(point);
    //layer.getSource().addFeature(point);
  }
}
添加点线面
function addGeometry(type,coordinate){
        var geometry = null
        if(type == 'point'){
          geometry = new ol.Feature({
            geometry: new ol.geom.Point(coordinate)
          });
          geometry.setProperties({
            name: '点',
            num: 11
          })
        }
        if(type == 'linestring'){
          geometry = new Feature({
            geometry: new LineString(coordinate)
          })
          geometry.setProperties({
            name: '线',
            num: 12
          })
        }
        if(type == 'polygon'){
          geometry = new Feature({
            geometry: new Polygon(coordinate)
          })
          geometry.setProperties({
            name: '面',
            num: 13
          })
        }
        geometry.setStyle((new Style({ //内部面选中样式
          fill: new Fill({
            color: 'rgba(32, 72, 145, 0.5)'
          }),
          stroke: new Stroke({
            color: '#00c4ff',
            width: 4
          }),
          image: new Circle({
            radius: 7,
            fill: new Fill({
              color: 'red'
            })
          })
        })))
        pointSource.addFeature(geometry);
      }
地图的几种事件
用到最多的应该就是单击事件了,目前见到的大概就是这么多了
map.on('click', this.mapClick);//地图点击
map.on('pointermove', this.mapPointerMove);//鼠标移入
map.on('singleclick', this.mapSingleClick);//地图单击
map.on('postcompose', this.animateFlights);//拖拽地图开始事件(不常用)
map.on('moveend', this.mapMoveEnd);//拖拽地图结束事件(不常用)地图事件详解——click单击事件的mapClick方法
当你点击地图的时候,就会触发这个方法
mapClick(evt){
  console.log(evt)//打印结果如下图
    if (this.map.hasFeatureAtPixel(evt.pixel)) {//判断是否点击的是加载的feature数据,点线面等
      //获取点击到的features,可能不止一个,根据需要取舍,在此取features[0]
      const features = this.map.getFeaturesAtPixel(evt.pixel);
      //可以对点击的feature进行一些操作,如显示点击图层的某个属性,以弹窗展示等等,或是设置点击feature高亮显示,当然这要根据具体功能来写了
    }
}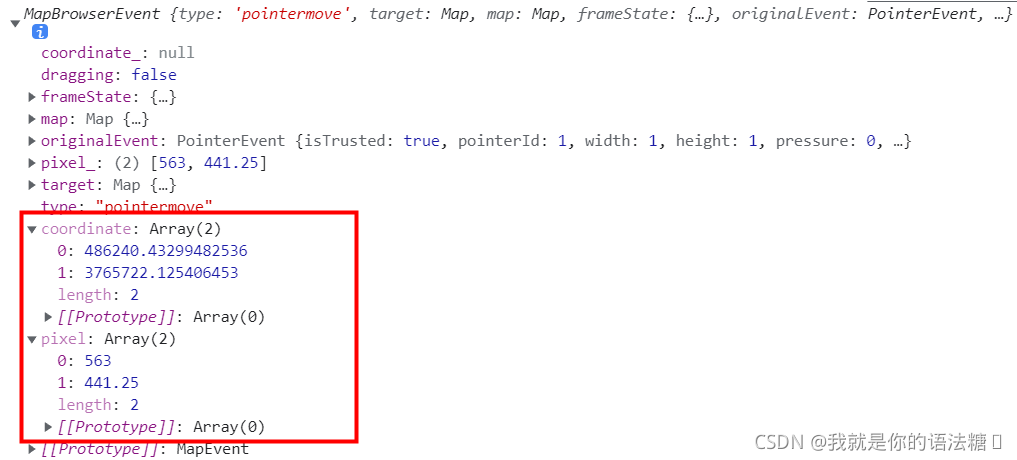
这是打印出来的evt的结果,我们常用到的也就是上面的二个属性evt.pixel和evt.coordinate
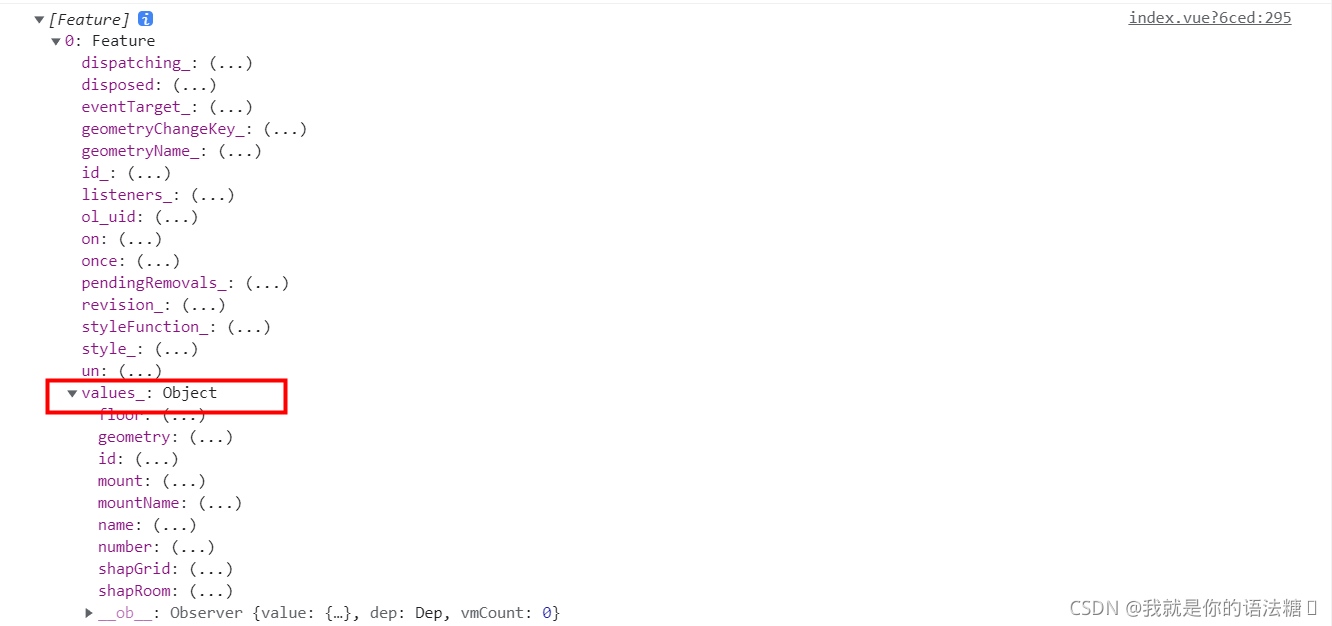
这是打印出来的features的结果,我们常用到的也就是上面的二个属性features[0].values_
地图事件详解——pointermove移入事件的mapPointerMove方法
移入事件和点击事件是一样的,只不过触发方式不同
mapPointerMove(evt){
  console.log(evt)//打印结果如下图
    if (this.map.hasFeatureAtPixel(evt.pixel)) {//判断是否点击的是加载的feature数据,点线面等
      //获取点击到的features,可能不止一个,根据需要取舍,在此取features[0]
      const features = this.map.getFeaturesAtPixel(evt.pixel);
      //可以对点击的feature进行一些操作,如显示点击图层的某个属性,以弹窗展示等等,或是设置点击feature高亮显示,当然这要根据具体功能来写了
    }
}
地图弹窗实现
initMap修改
initMap(){
var container = document.getElementById('popup');
var content = document.getElementById('popupcontent');
var overlay = new Overlay({
element: container,
autoPan: true,
autoPanAnimation: {
duration: 250
}
});
const map = new Map({
target: 'map',
// logo: false,
layers: [],
view: new View({
// 地图视图
projection: 'EPSG:4326', // 坐标系,有EPSG:4326和EPSG:3857
center: [117.2531, 31.861184], // 坐标 安徽
// minZoom: 10, // 地图缩放最小级别
zoom: 8 // 地图缩放级别
}),
overlays: [overlay]
})
this.map = map
this.newoverlay = overlay
this.newcontent = content
const wkid = "EPSG:4326"
//天地图底图
this.addTiandiLayer("http://t{0-7}.tianditu.com/DataServer?T=vec_w&tk=申请的天地图
key&x= {x}&y={y}&l={z}",wkid)
//天地图标注图层
this.addTiandiLayer("'http://t{0-7}.tianditu.com/DataServer?T=cva_w&tk=申请的天地图
key&x= {x}&y={y}&l={z}'",wkid)
},
mapClick(evt){
if (this.map.hasFeatureAtPixel(evt.pixel)) {
const features = this.map.getFeaturesAtPixel(evt.pixel);
//判断点击的是否为点数据,面改为Polygon,线改为Line
if(features[0].getGeometry() instanceof Point){
const cor = evt.coordinate
const data = features[0].values_
this.addPopup(data,cor)//展示弹窗
}else{
this.newoverlay.setPosition(undefined);// 否则不显示
}
}
}
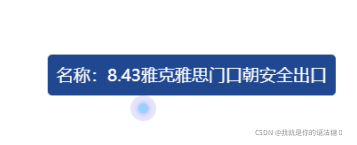
addPopup(data,cor){
if(data.name){
this.newcontent.innerHTML = '<div><span>名称:</span><span
class="popup_code">' +
data.name + '</span></div';
this.newoverlay.setPosition(cor);
}
},temlate
<div id="mapDiv" class="device-mapDiv"></div>
// 弹窗
 <div id="popup" class="ol-popup" style="background:rgba(32, 72, 145, 1);">
    <div id="popupcontent" class="popupcontent"></div>
 </div>
弹窗样式css
.ol-popup{
    position: relative;
    left: -100px;
    top: -55px;
    border-radius: 5px;
  }
  .popupcontent{
    height: 46px;
    padding: 10px;
    font-family: 'Open Sans';
    color: #FFF;
    font-size: 19px;
  }
  .ol-popup:after, .ol-popup:before {
    top: 100%;
    border: solid transparent;
    content: " ";
    height: 0;
    width: 0;
    position: absolute;
    pointer-events: none;
  }
  .ol-popup:after {
    // border-top-color: white;
    // border-width: 10px;
    left: 48px;
    margin-left: -10px;
  }
  .ol-popup:before {
    // border-top-color: #cccccc;
    // border-width: 11px;
    left: 48px;
    margin-left: -11px;
  }
点击事件就完成了,内容可以根据需要修改
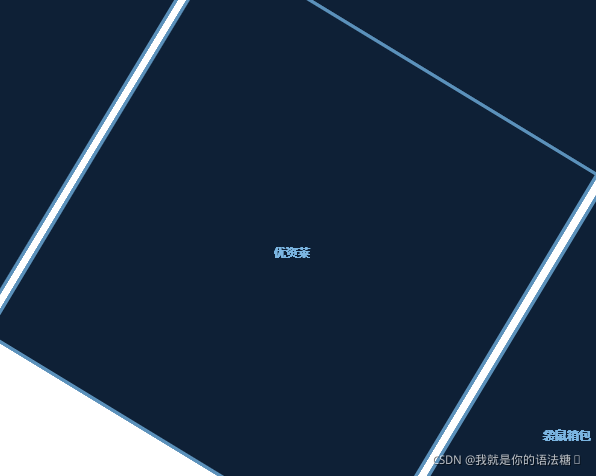
如何加载矢量面的时候,将面的名称也显示出来
设置样式的时候加个text就好了
for (let i = 0; i < data.length; i++) {
  var source = new VectorSource();
  var layer = new VectorLayer({
      source: this.source
  });
  if (data[i].floor == selectfloor) {
    //wkt转feature数据
    let wkt = data[i].shape;
    let format = new WKT();
    let feature = format.readFeature(wkt);
    feature.setProperties(data[i]);
    source.addFeature(feature);
    feature.setStyle(addStyle(feature));
    function addStyle () {
      let style = new Style({
        fill: new Fill({
          color: '#0e2036'
        }),
        stroke: new Stroke({
          color: '#5b91bb',
          width: 3
         }),
         text: new Text({
           text: `${feature.getProperties().name}`,
           textAlign: 'center',
           font: 'bold 12px sans-serif',
           fill: new Fill({
             color: '#7bb5e1'
           })
         })
       });
       return style;
     }
   }
}
图层层级顺序修改
layer.setZIndex(index)图层透明度修改
layer.setOpacity(alpha)删除layer
removeLayer (id) {
      const layers = this.map.getLayers();
      let layer = null;
      layers.forEach(item => {
        if (item.get('id') === id) {
          layer = item;
          return;
        }
      })
      if (layer) {
        this.map.removeLayer(layer);
      }
    }
加载wkt数据
 this.source = new VectorSource()
 this.layer = new VectorLayer({
      source: this.source,
      style: new Style({
        fill: new Fill({
         color: 'red'
        }),
        stroke: new Stroke({
         color: 'red',
         width: 2
       }),
       image: new CircleStyle({
        radius: 7,
        fill: new Fill({
         color: 'red'
       })
     })
   })
 });
 this.map.addLayer(this.layer)

 let wkt = data// data为wkt数据
 let feature = format.readFeature(wkt);
 feature.setProperties(xxx)// 为feature数据设置属性
 this.source.addFeature(feature);
编辑shape
addDraw(type) {
            // 编辑shape数据
            this.modify = new Modify({
                source: this.source
            });
            this.map.addInteraction(this.modify);
            // const that = this;
            this.modify.on('modifyend', (evt) => {
                let feature = evt.features.item(0)
            });
            // 绘制shape数据
            const draw = new Draw({
                source: this.source,
                type: type
            });
            this.map.addInteraction(draw);
            let snap = new Snap({ source: this.source });
            this.map.addInteraction(snap);
            draw.setActive(true);

            //绘制结束
            draw.on('drawend', (e) => {
                draw.setActive(false);
                //绘制出的要素
                let feature = e.feature
            });
  }
定位到选中数据并高亮
selectFeature(data) {// data所选择数据
        this.source.forEachFeature(feature => {
                // console.log(feature.getProperties())
                if ((data === feature.getProperties().id)) {
                    const MapZoom = feature.getGeometry().getExtent();
                    // let mapPadding = [20, 10, 20, 10];
                    this.map.getView().fit(MapZoom, this.map.getSize(), {
                        constrainResolution: false,
                        earest: false
                        // padding: mapPadding
                    });
                    feature.setStyle(selectStyle());
                }
            });

            function selectStyle() {
                let style = new Style({
                    fill: new Fill({
                        color: 'rgba(255, 255, 255, 0.2)'
                    }),
                    stroke: new Stroke({
                        color: '#ffcc33',
                        width: 2
                    }),
                    image: new CircleStyle({
                        radius: 7,
                        fill: new Fill({
                            color: '#ffcc33'
                        })
                    })
                });
                return style;
            }
        }
移除图层
removeLayer (id) {
      const layers = this.map.getLayers();
      let layer = null;
      layers.forEach(item => {
        if (item.get('id') === id) {
          layer = item;
        }
      })
      if (layer) {
        this.map.removeLayer(layer);
      }
 }
先更新到这了,之后遇到问题会持续更新~~


 1960
1960

 被折叠的 条评论
为什么被折叠?
被折叠的 条评论
为什么被折叠?
 到【灌水乐园】发言


