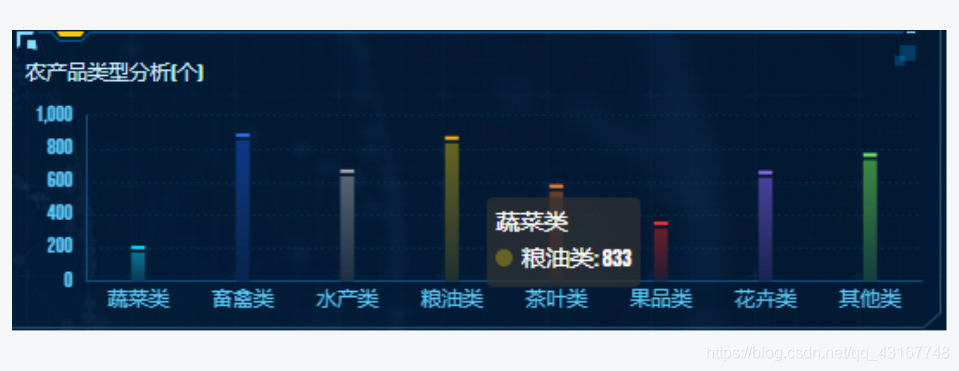
1.最终效果图
2.echarts文件(ncplxfx.js)
import echarts from "echarts";
export const ncplxfxOption = (xData, sData) => {
let colorArr = [
{
top: "#097693",
bottom: "#0a3753",
end: "#00d8fa"
},
{
top: "#0f3985",
bottom: "#07254b",
end: "#2970ff"
},
{
top: "#566370",
bottom: "#1d3046",
end: "#a7a7a7"
},
{
top: "#666423",
bottom: "#213030",
end: "#f8b618"
},
{
top: "#68412b",
bottom: "#232530",
end: "#ff8635"
},
{
top: "#691e2b",
bottom: "#201c35",
end: "#ff3333"
},
{
top: "#48419a",
bottom: "#17254f",
end: "#9473ff"
},
{
top: "#3c8a43",
bottom: "#133e3d",
end: "#71f974"
}
];
let option = {
textStyle: {
fontFamily: "BebasNeue"
},
tooltip: {
axisPointer: {
type: "shadow",
textStyle: {
color: "#fff"
}
}
},
grid: {
borderWidth: 0,
top: "10%",
left: "10%",
right: "2%",
bottom: "20%",
textStyle: {
color: "#fff"
}
},
legend: {
show: false,
orient: "vertical",
icon: "roundRect",
right: "4%",
top: "6%",
textStyle: {
color: "red"
},
data: ["蔬菜类", "畜禽类", "水产类", "粮油类", "茶叶类", "果品类", "花卉类", "其他类"]
},
yAxis: [
{
type: "value",
splitNumber: 4,
axisLine: {
show: true,
lineStyle: {
color: "#115080"
}
},
splitLine: {
show: true,
lineStyle: {
color: "#115080",
width: "0.5",
type: "dashed",
opacity: "0.5"
}
},
axisTick: {
show: false
},
splitArea: {
show: false
},
axisLabel: {
interval: 0,
textStyle: {
color: "#59c9f9",
fontSize: 12
}
}
}
],
xAxis: [
{
type: "category",
splitLine: {
show: false
},
splitNumber: 4,
axisLine: {
lineStyle: {
color: "#115080",
type: "solid"
}
},
axisTick: {
show: false
},
axisLabel: {
interval: 0,
show: true,
margin: 5,
textStyle: {
color: "#59c9f9",
fontSize: 12
}
},
splitArea: {
show: false
},
data: xData
}
],
series: [
{
name: "蔬菜类",
type: "bar",
barWidth: 8,
itemStyle: {
normal: {
color: function(params) {
let num = colorArr.length;
return new echarts.graphic.LinearGradient(
0,
0,
0,
1,
[
{
offset: 0,
color: colorArr[params.dataIndex % num].top
},
{
offset: 1,
color: colorArr[params.dataIndex % num].bottom
}
],
false
);
}
}
},
data: sData
},
{
type: "pictorialBar",
barGap: "-100%",
symbol: "rect",
symbolPosition: "end",
symbolSize: [8, 2],
symbolOffset: [0, -4],
data: sData.map((x, index) => {
return {
value: x,
itemStyle: {
color: colorArr[index].end
}
};
})
}
]
};
return option;
};
3.vue文件中
3.1 html
<div style="width:30vh;height:30vh" ref="ncplxfxChart"></div>
3.2 js逻辑处理(引入ncplxfx.js)
<script>
import { ncplxfxOption } from "@/assets/js/xxjyzt/ncplxfx";
export default {
data(){},
methods: {
ncplxfx() {
let xData = ["蔬菜类", "畜禽类", "水产类", "粮油类", "茶叶类", "果品类", "花卉类", "其他类"];
let sData = [172, 850, 633, 833, 542, 318, 625, 731];
let ncplxfxChartEle = this.$echarts.init(this.$refs.ncplxfxChart);
ncplxfxChartEle.setOption(ncplxfxOption(xData, sData));
},
initEcharts() {
let ncplxfxChartEle = this.$echarts.init(this.$refs.ncplxfxChart);
window.addEventListener("resize", function() {
ncplxfxChartEle.resize();
});
}
},
mounted() {
this.ncplxfx();
this.initEcharts();
}
}
</script>


 5220
5220

 被折叠的 条评论
为什么被折叠?
被折叠的 条评论
为什么被折叠?
 到【灌水乐园】发言


