


 本文介绍了Python中使用Matplotlib库进行图像绘制的基础知识,包括创建figure对象,设置参数如dpi、facecolor和edgecolor,以及如何使用ImageGrid创建多个子图。示例中展示了如何关闭坐标轴,以及绘制折线图的方法,包括两种不同的plot调用方式。文章还提供了官方文档链接供深入学习。
from matplotlib.colors import Normalize
import matplotlib.pyplot as plt
from mpl_toolkits.axes_grid1 import ImageGrid
import numpy as np
import matplotlib
from typing import List
利用上面的头文件进行画图
figure(num=None, figsize=None, dpi=None, facecolor=None, edgecolor=None, frameon=True)
num:图像编号或名称,数字为编号 ,字符串为名称
figsize:指定figure的宽和高,单位为英寸;
dpi参数指定绘图对象的分辨率,即每英寸多少个像素,缺省值为80 1英寸等于2.5cm,A4纸是 21*30cm的纸张
facecolor:背景颜色
edgecolor:边框颜色
frameon:是否显示边框
参考:python中的figure什么意思_plt.figure()参数使用详解及运行演示
grid = ImageGrid(fig,
				111,#与subplot(111)相似
                nrows_ncols=(n_rows, n_columns),#设置n_rows* n_columns大小的坐标系
                axes_pad=(0.1, 0.3),#pad between axes in inch
                direction='row',#Whether axes are created in row-major ("row by row") or column-major order ("column by column"). This also affects the order in which axes are accessed using indexing (grid[index]).
                     )#这里已经相当于构建了一个大的坐标系
参考:
    ax2 = fig.add_subplot(233)#第一个表示行,第二个表示列,第三个表示这个图的位置
    ax2.imshow(img_q)
    ax2.axis('off')#去除坐标系
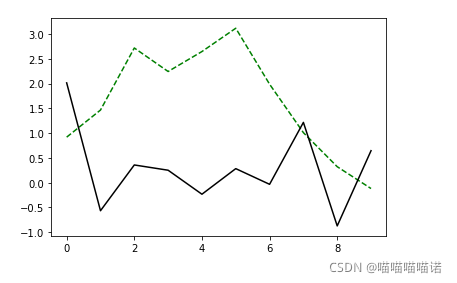
折线图
data = np.random.randn(10).cumsum()
data1 = np.random.randn(10)#.cumsum()
#data
#method1
plt.plot(data,'g--')
plt.plot(data1,'k--')
plt.title('data')
#method2
fig = plt.figure()
ax = fig.add_subplot(1,1,1)
ax.plot(data,'g--')
ax.plot(data1,'k')


 2555
2555

 被折叠的 条评论
为什么被折叠?
被折叠的 条评论
为什么被折叠?
 到【灌水乐园】发言


