


 本文深入探讨了Mayavi中的quiver3d和points3d函数,详细解析了如何使用这些函数进行三维向量场和点集的可视化。通过实例展示了不同参数配置下矢量箭头和点的绘制效果,适合于流体力学和数据可视化领域的研究者。
秉着边学边写边折腾的原则,开始粗糙的工作。真正掌握还是得讲解给别人听。 先给出网课
https://www.icourse163.org/course/BIT-1001871001
Mayavi官方
http://docs.enthought.com/mayavi/mayavi/genindex.html
(有时候这网站会装死,一般过几个小时就会活过来)
我发现了,光是三流操作还不够,还得加上四流翻译。
我把目录从这里剔除出去了,否则每次改很麻烦。
这周因为要做一个图示,所以就先把quiver提上来说一下
points3d,quiver3d
单从这两个函数名大概对这两个是比较清楚的,分别绘制的是点和向量。
这两个放在一起也是因为他们的相似参数很多,因为它们都是对点的描述。
这两个而言,是非常有用的两个函数,我比较常用的就是quiver3d因为要绘制向量信息等,这玩意貌似是可以来绘制风场流场的,流体力学是有相当多的应用的。
另外一个points3d的操作很灵活,分析实例的时候有空再说。
1.quiver3d
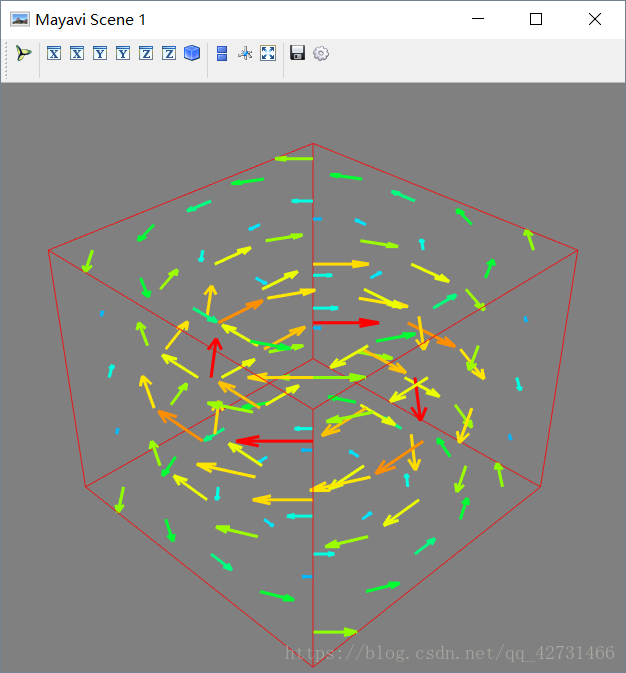
老规矩从官方例子开始,先微调一下官方代码
import numpy as np
from mayavi.mlab import *
x, y, z = np.mgrid[-2:3, -2:3, -2:3]
r = np.sqrt(x ** 2 + y ** 2 + z ** 4)
u = y * np.sin(r) / (r + 0.001)
v = -x * np.sin(r) / (r + 0.001)
w = np.zeros_like(z)
obj = quiver3d(x, y, z, u, v, w, line_width=3, scale_factor=1)
outline(color=(1,0,0),opacity=0.8)
show()
文档中对这个函数的描述如下:
Plots glyphs (like arrows) indicating the direction of the vectors at the positions supplied.
在所给位置放置图形(比如箭头)来表示该处向量的方向。
语法如下:
quiver3d(u, v, w, ...)
quiver3d(x, y, z, u, v, w, ...)
quiver3d(x, y, z, f, ...)
u, v, w are numpy arrays giving the components of the vectors.
If only 3 arrays, u, v, and w are passed, they must be 3D arrays, and the positions of the arrows are assumed to be the indices of the corresponding points in the (u, v, w) arrays.
If 6 arrays, (x, y, z, u, v, w) are passed, the 3 first arrays give the position of the arrows, and the 3 last the components. They can be of any shape.
If 4 positional arguments, (x, y, z, f) are passed, the last one must be a callable, f, that returns vectors components (u, v, w) given the positions (x, y, z).
.
u,v,w由numpy数组给定。
如果只给定(u, v, w),它们必须是一个3D array,且向量箭头的位置假定和(u,v,w)相匹配。
如果(x, y, z, u, v, w),6个参数被给定,那么前3个arrays给定箭头所在的位置,后三个给定向量,它们的形状可以是任意的。
如果是 (x, y, z, f)的形式,最后一个必须有返回值,(u, v, w)由f返回。
以下开始举例
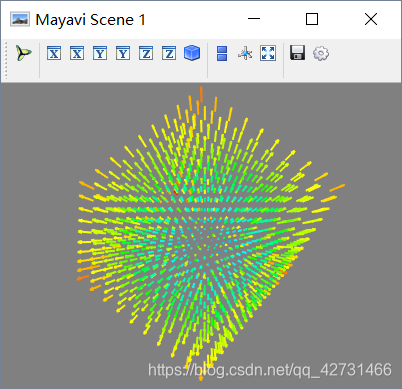
1.(u, v, w)
代码如下
x,y,z = np.mgrid[-5:5,-5:5,-5:5]
mlab.quiver3d(x, y, z)
mlab.show()
2.(x, y, z, f)
.代码如下:
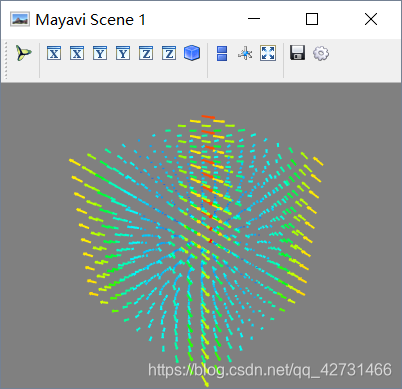
def Shift(x,y,z):
    u = x
    v = x*y
    w = z-1
    return u,v,w
x,y,z = np.mgrid[-5:5,-5:5,-5:5]
mlab.quiver3d(x, y, z,labf)
mlab.show()
也就是多了一了一个
f
最后一种就是传入quiver3d(x, y, z, u, v, w, ...)的形式,不再举例了。
另一例子里面用的是quiver3d(list_x,list_y,list_z,vect_x,vect_y,vect_z,scale_factor=.1)传递的是6个量,这个无所谓的,和这里的方式是一样的~牵涉很多修饰参数,所以看起来率复杂一点。
例子参考:
https://blog.youkuaiyun.com/qq_42731466/article/details/83310151
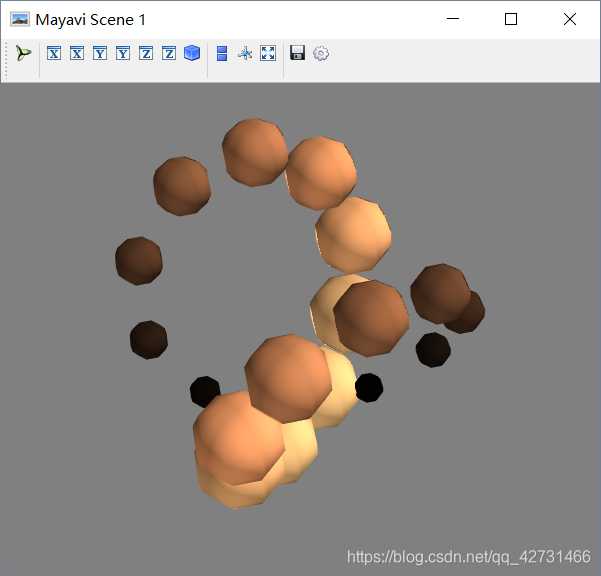
2.points3d
官方实例微调之后如下。
import numpy as np
from mayavi import mlab
def test_points3d():
    t = np.linspace(0, 4 * np.pi, 20)
    x = np.sin(2 * t)
    y = np.cos(t)
    z = np.cos(2 * t)
    s = 2 + np.sin(t)
    return mlab.points3d(x, y, z, s, colormap="copper", scale_factor=.25)
test_points3d()
mlab.show()
改写一下,其实更清晰一些,但是我什么都没做。后面我用这个说明
import numpy as np
from mayavi import mlab

t = np.linspace(0, 4 * np.pi, 20)
x,y,z = np.sin(2 * t),np.cos(t),np.cos(2 * t)
s = 2 + np.sin(t)

mlab.points3d(x, y, z, s, colormap="copper", scale_factor=.25)
mlab.show()
Plots glyphs (like points) at the position of the supplied data.
在所给位置放置一个图形(点)。
.
语法如下
points3d(x, y, z...)
points3d(x, y, z, s, ...)
points3d(x, y, z, f, ...)x, y and z are
numpyarrays, or lists, all of the same shape, giving the positions of the points.
If only 3 arrays x, y, z are given, all the points are drawn with the same size and color.
In addition, you can pass a fourth array s of the same shape as x, y, and z giving an associated scalar value for each point, or a function f(x, y, z) returning the scalar value. This scalar value can be used to modulate the color and the size of the points.
.
x,y,z为numpyarray或者list,他们必须具有相同的维度来表示所要绘制的点的位置。
如果给定x,y,z三个维度,所有的点将被绘制成相同的大小和颜色。
除此之外,你可以传入第4个array的s作为参数,它同样和x,y,z保持相同的维度,为每一个点设置标量值,也可以是一个f函数的形式返回x,y,z的标量值,这个标量值可以用来修改每一个点的颜色的和大小。
.
官方实例中
x,y,z = np.sin(2 * t),np.cos(t),np.cos(2 * t)
s = 2 + np.sin(t)
这2句其实都是围绕t = np.linspace(0, 4 * np.pi, 20),维度是由t控制的,所以肯定不会出错,这里利用了一个参数方程的思想。
然后最后完成绘制和可视
mlab.points3d(x, y, z, s, colormap="copper", scale_factor=.25)
mlab.show()所以如果画图的话我也建议使用这种方式,而不是官方的实例,如果代码量大了另当别论。总之灵活处理但不丧失良好可读性。
3.参数
points3d,quiver3d这两个参数之间的不同仅仅在于一个scalars,这个scalars是quiver3d具备的。
其实我是很好奇的,因为这个scalars实际上是赋不进去的
t = np.linspace(0, 4 * np.pi, 20)
x,y,z = np.sin(2 * t),np.cos(t),np.cos(2 * t)
s = 2 + np.sin(t)
sca = t-t    #直接变成和t长度相同的0向量
mlab.quiver3d(x,y,z,x,y,z,scalars=t,scale_factor=1,line_width=3.0)
mlab.points3d(x, y, z, s, colormap="copper", scale_factor=.25)
mlab.show()
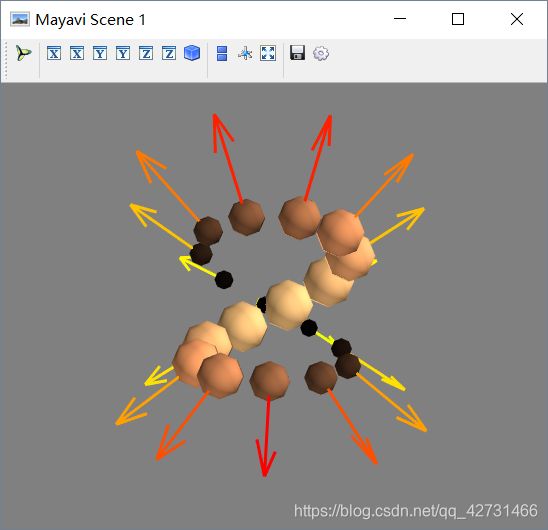
这里标量
scalars赋的是0,按理说所有的箭头应具备相同的颜色,但是事实上,一旦 u,v,w一旦给定,那么箭头的长度即确定,且标量也随之确定。所以scalars传入既不会报错也不会有任何改变。
4.补充
暂无
以后减慢更新速度稍微更点想起来的例子玩。
填坑区:
更新
2018.10.20.——因为机器学习的缘故要绘制一个图像,顺带把quiver3d写一点
2018.12.08.——考试繁忙等了很久才更了一下。更完。


 39
39

 被折叠的 条评论
为什么被折叠?
被折叠的 条评论
为什么被折叠?
 到【灌水乐园】发言


