


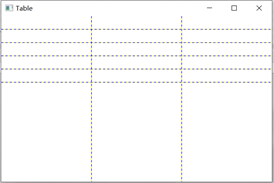
WPF的Grid布局使用起来很方便,但如果我想绘制一个带有边线的表格则显得有点儿力不从心。虽然Grid有ShowGridLines这个bool类型的属性,但此属性设为true时显示的虚线而且不能改变颜色。比如下面的代码:
<Window x:Class="Table.MainWindow"
        xmlns="http://schemas.microsoft.com/winfx/2006/xaml/presentation"
        xmlns:x="http://schemas.microsoft.com/winfx/2006/xaml"
        Title="Table" Height="350" Width="525">
    <Grid ShowGridLines="True">
        <Grid.RowDefinitions>
            <RowDefinition Height="25" />
            <RowDefinition Height="25" />
            <RowDefinition Height="25" />
            <RowDefinition Height="25" />
            <RowDefinition Height="25" />
            <RowDefinition Height="25" />
        </Grid.RowDefinitions>
        <Grid.ColumnDefinitions>
            <ColumnDefinition/>
            <ColumnDefinition/>
            <ColumnDefinition/>
        </Grid.ColumnDefinitions>
    </Grid>
</Window>
效果图如下:
那么,如何让Grid“作table状”呢?
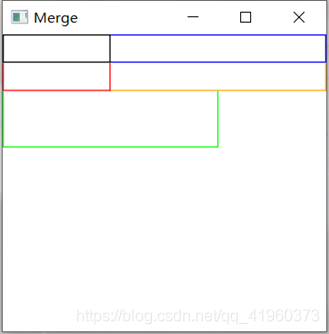
使用Border控件
使用Border的BorderThickness属性可以控制Border各边的显隐粗细(粗细为0就是不显示)。使用BorderBrush属性则可灵活控制每个单元格的边线颜色。看下面的代码:
<Window x:Class="Table.Table"
        xmlns="http://schemas.microsoft.com/winfx/2006/xaml/presentation"
        xmlns:x="http://schemas.microsoft.com/winfx/2006/xaml"
        Title="Table_1" Height="300" Width="300">
    <Grid ShowGridLines="False">
        <Grid.RowDefinitions>
            <RowDefinition Height="25" />
            <RowDefinition Height="25" />
            <RowDefinition Height="25" />
            <RowDefinition Height="25" />
            <RowDefinition Height="25" />
            <RowDefinition Height="25" />
        </Grid.RowDefinitions>
        <Grid.ColumnDefinitions>
            <ColumnDefinition/>
            <ColumnDefinition/>
            <ColumnDefinition/>
        </Grid.ColumnDefinitions>
        <Border BorderBrush="Black" BorderThickness="1" Grid.Column="0" Grid.Row="0"/>
        <Border BorderBrush="Blue" BorderThickness="0,1,1,1" Grid.Column="1" Grid.Row="0" Grid.ColumnSpan="2"/>
        <Border BorderBrush="Red" BorderThickness="1,0,1,1" Grid.Column="0" Grid.Row="1"/>
        <Border BorderBrush="Orange" BorderThickness="0,0,1,1" Grid.Column="1" Grid.Row="1" Grid.ColumnSpan="2"/>
        <Border BorderBrush="Lime" BorderThickness="1,0,1,1" Grid.Column="0" Grid.Row="2" Grid.ColumnSpan="2" Grid.RowSpan="2"/>
    </Grid>
</Window>
效果图如下:
最后提醒一点,如果是大批量的绘制表格那么这种手动写代码的方式就划不来了。应该使用DataTemplate来显示数据,在DataTemplate里恰当地使用Border并为其BorderThickness和Column/Row/ColumnSpan/RowSpan设置恰当的Binding。


 1万+
1万+

 被折叠的 条评论
为什么被折叠?
被折叠的 条评论
为什么被折叠?
 到【灌水乐园】发言


