


代码在jupyter notebook中运行,如果IDE是其他需在代码最后添加plt.show()
import numpy as np
import matplotlib.pyplot as plt
%matplotlib inline

#中文乱码问题解决
plt.rcParams['font.sans-serif'] = ['Simhei']
plt.rcParams['axes.unicode_minus'] = False
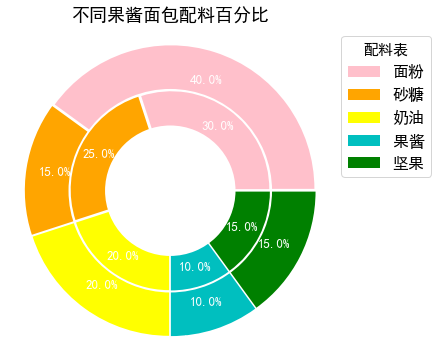
实例一(关于饼图的绘制)
plt.rcParams.update({'font.size':15})
plt.figure(figsize=(6,6))
elements = ["面粉","砂糖","奶油","果酱","坚果"]
a = [0.4, 0.15, 0.2, 0.1, 0.15]
b = [0.3, 0.25, 0.2, 0.1, 0.15]
colors=['pink','orange','yellow','c','g']
plt.pie(a, colors=colors,explode=[0.015, 0.015, 0.015, 0.015, 0.015],autopct='%.1f%%',pctdistance=0.8,textprops={'fontsize':13, 'color':'white'},radius=1.1)
plt.pie([1], colors='w',radius=0.78)
plt.pie(b, colors=colors,explode=[0.015, 0.015, 0.015, 0.015, 0.015],radius=0.75, autopct='%.1f%%',pctdistance=0.8,textprops={'fontsize':13, 'color':'white'})
plt.pie([1], colors='w',radius=0.5)
plt.title("不同果酱面包配料百分比",fontsize=18)
plt.legend(labels=elements,loc=0,title='配料表',fontsize=16,bbox_to_anchor=(1,1))
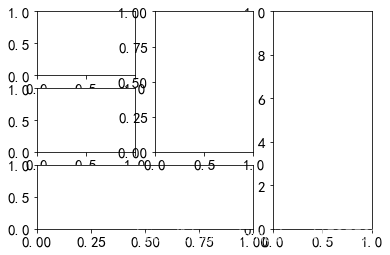
实例二(关于画布分割成数个子画布)
ax1 = plt.subplot2grid((3,3), (0,0))
ax2 = plt.subplot2grid((3,3), (1,0))
ax3 = plt.subplot2grid((3,3), (0,2), rowspan=3)
ax4 = plt.subplot2grid((3,3), (2,0), colspan=2)
ax5 = plt.subplot2grid((3,3), (0,1), rowspan=2)
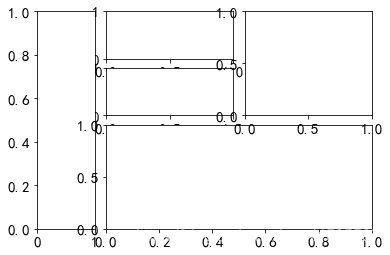
ax1 = plt.subplot2grid((4,5), (0,1),colspan=2)
ax2 = plt.subplot2grid((4,5),(1,1),colspan=2)
ax3 = plt.subplot2grid((4,5), (0,0), rowspan=4,colspan=1)
ax4 = plt.subplot2grid((4,5),(2,1),colspan=4,rowspan=2)
ax5 = plt.subplot2grid((4,5),(0,3),colspan=2,rowspan=2)
…持续更新中…


 被折叠的 条评论
为什么被折叠?
被折叠的 条评论
为什么被折叠?
 到【灌水乐园】发言


