


 本文介绍了如何通过观察描述性统计、划分数据组比较均值和方差以及使用ADF检验来判断时间序列数据的平稳性。以航空公司乘客数据为例,展示了非平稳和平稳数据的区别,并强调了ADF单位根检验在时间序列稳定性检测中的重要性。
时间序列数据通常以其时间性质为特征。这种时间性质为数据增加了趋势或季节性,使其与时间序列分析和预测兼容。如果时间序列数据不随时间变化或没有时间结构,则称其为静态数据。因此,检查数据是否平稳是非常必要的。在时间序列预测中,如果数据是平稳的,我们就无法从数据中获得有价值的见解。
静态数据的示例图:
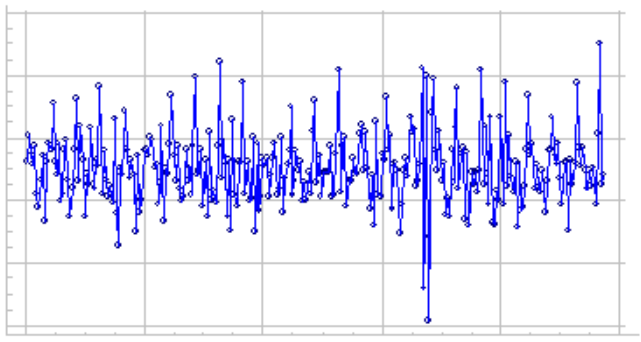
平稳性的类型
当涉及到识别数据是否是平稳的时,这意味着识别数据中平稳性的细粒度概念。在时间序列数据中观察到的平稳性类型包括:
-
趋势平稳 :不显示趋势的时间序列。
-
季节性平稳(Seasonal Stationary):不显示季节性变化的时间序列。
-
严格平稳:观测值的联合分布不随时间变化。
实现方法及步骤
下面的步骤将让用户容易地理解检查给定时间序列数据是否平稳的方法。
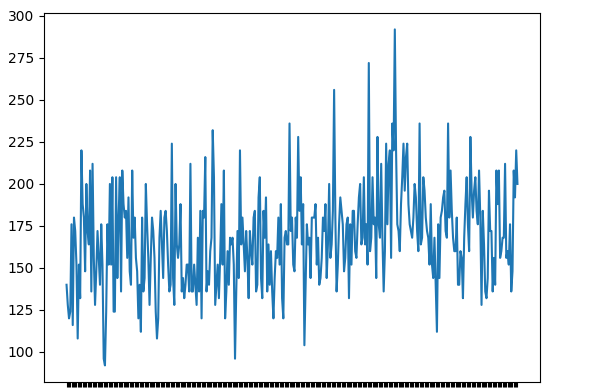
步骤1:绘制时间序列数据
 # import python pandas library
 import pandas as pd

 # import python matplotlib library for plotting
 import matplotlib.pyplot as plt

 # read the dataset using pandas read_csv()
 # function
 data = pd.read_csv("daily-total-female-births-IN.csv",
                header=0, index_col=0)

# use simple line plot to see the distribution
# of the data
plt.plot(data)
输出
步骤2:评估描述性统计量
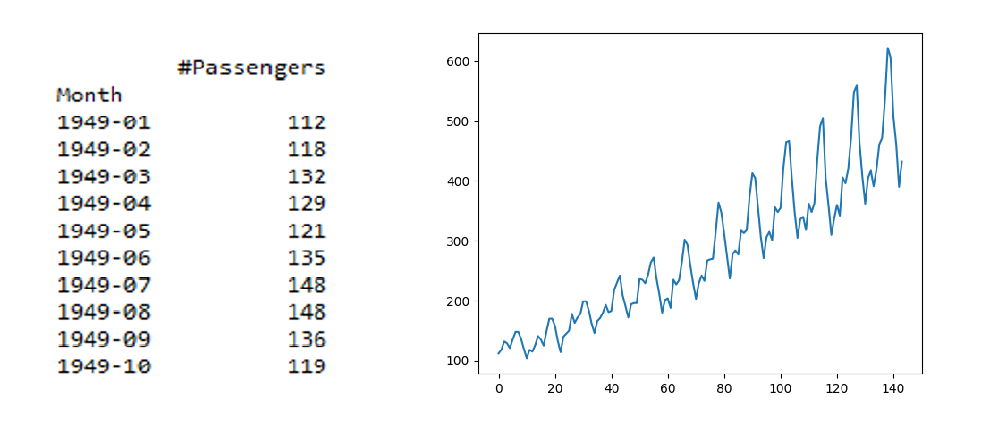
这通常是通过将数据分成两个或多个分区并计算每组的均值和方差来完成的。如果这些一阶矩在这些分区之间是一致的,那么我们可以假设数据是平稳的。让我们使用1949 - 1960年之间的航空公司乘客计数数据集。
 # import python pandas library
 import pandas as pd

 # import python matplotlib library for
 # plotting
import matplotlib.pyplot as plt

 # read the dataset using pandas read_csv()
 # function
data = pd.read_csv("AirPassengers.csv",
                header=0, index_col=0)

# print the first 6 rows of data
print(data.head(10))

# use simple line plot to understand the
# data distribution
plt.plot(data)
现在,让我们将这些数据划分为不同的组,计算不同组的均值和方差,并检查一致性。
 # import the python pandas library
 import pandas as pd

 # use pandas read_csv() function to read the dataset.
 data = pd.read_csv("AirPassengers.csv", header=0, index_col=0)

 # extracting only the air passengers count from
 # the dataset using values function
 values = data.values

# getting the count to split the dataset into 3
parts = int(len(values)/3)

# splitting the data into three parts
part_1, part_2, part_3 = values[0:parts], values[parts:(
    parts*2)], values[(parts*2):(parts*3)]

# calculating the mean of the separated three
# parts of data individually.
mean_1, mean_2, mean_3 = part_1.mean(), part_2.mean(), part_3.mean()

# calculating the variance of the separated
# three parts of data individually.
var_1, var_2, var_3 = part_1.var(), part_2.var(), part_3.var()

# printing the mean of three groups
print('mean1=%f, mean2=%f, mean2=%f' % (mean_1, mean_2, mean_3))

# printing the variance of three groups
print('variance1=%f, variance2=%f, variance2=%f' % (var_1, var_2, var_3))
输出
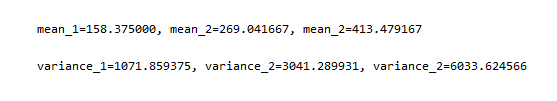
输出清楚地表明,三组的平均值和方差彼此差异很大,说明数据是非平稳的。例如,如果平均值mean_1 = 150,mean_2 = 160,mean_3 = 155和variance_1 = 33,variance_2 = 35,variance_3 = 37,那么我们可以得出结论,数据是平稳的。有时这种方法可能会对某些分布失败,如对数范数分布。
让我们尝试与上面相同的示例,但使用NumPy的log()函数获取乘客计数的日志并检查结果。
 # import python pandas library
 import pandas as pd

 # import python matplotlib library for plotting
 import matplotlib.pyplot as plt

# import python numpy library
import numpy as np

# read the dataset using pandas read_csv()
# function
data = pd.read_csv("AirPassengers.csv", header=0, index_col=0)

# extracting only the air passengers count
# from the dataset using values function
values = log(data.values)

# printing the first 15 passenger count values
print(values[0:15])

# using simple line plot to understand the
# data distribution
plt.plot(values)
输出
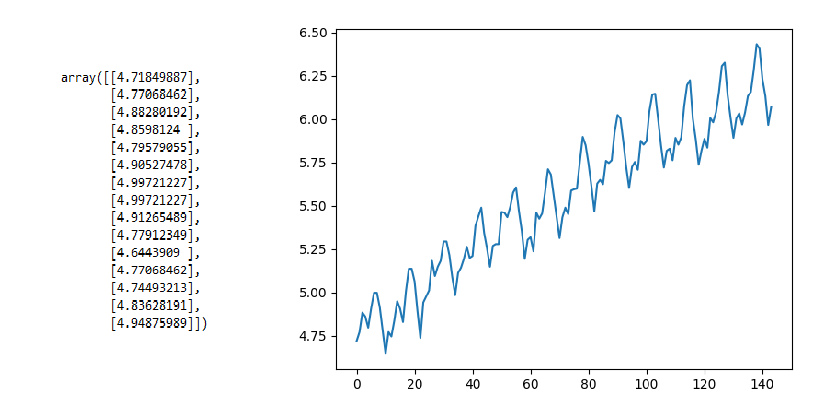
输出表示有一些趋势,但不像前面的情况那样非常陡峭,现在让我们计算分区均值和方差。
 # getting the count to split the dataset
 # into 3 parts
 parts = int(len(values)/3)

 # splitting the data into three parts.
 part_1, part_2, part_3 = values[0:parts], values[parts:(parts*2)], values[(parts*2):(parts*3)]

 # calculating the mean of the separated three
 # parts of data individually.
mean_1, mean_2, mean_3 = part_1.mean(), part_2.mean(), part_3.mean()

# calculating the variance of the separated three
# parts of data individually.
var_1, var_2, var_3 = part_1.var(), part_2.var(), part_3.var()

# printing the mean of three groups
print('mean1=%f, mean2=%f, mean2=%f' % (mean_1, mean_2, mean_3))

# printing the variance of three groups
print('variance1=%f, variance2=%f, variance2=%f' % (var_1, var_2, var_3))
输出

理想情况下,我们会期望均值和方差非常不同,但它们是相同的,在这种情况下,这种方法可能会非常失败。为了避免这种情况,我们有另一个统计测试,下面讨论。
步骤3:增强的Dickey-Fuller检验
这是一个统计测试,专门用于测试单变量时间序列数据是否平稳。这个测试是基于一个假设,可以告诉我们它可以被接受的概率程度。它通常被归类为单位根检验之一,它决定了一个单变量时间序列数据遵循趋势的强度。我们来定义零假设和替代假设,
-
Ho(假设):时间序列数据是非平稳的
-
H1(替代假设):时间序列数据是平稳的
假设α = 0.05,表示(95%置信度)。如果p > 0.05不能拒绝零假设,则用p值解释检验结果,否则如果p <= 0.05则拒绝零假设。现在,让我们使用相同的航空乘客数据集,并使用stats model包提供的adfuller()统计函数对其进行测试,以检查数据是否稳定。
 # import python pandas package
 import pandas as pd

 # import the adfuller function from statsmodel
 # package to perform ADF test
 from statsmodels.tsa.stattools import adfuller

 # read the dataset using pandas read_csv() function
 data = pd.read_csv("AirPassengers.csv", header=0, index_col=0)

# extracting only the passengers count using values function
values = data.values

# passing the extracted passengers count to adfuller function.
# result of adfuller function is stored in a res variable
res = adfuller(values)

# Printing the statistical result of the adfuller test
print('Augmneted Dickey_fuller Statistic: %f' % res[0])
print('p-value: %f' % res[1])

# printing the critical values at different alpha levels.
print('critical values at different levels:')
for k, v in res[4].items():
    print('\t%s: %.3f' % (k, v))
输出
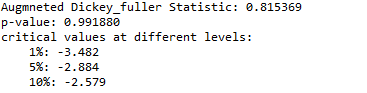
根据我们的假设,ADF统计量远远大于不同水平的临界值,并且p值也大于0.05,这意味着我们无法在90%,95%和99%的置信度下拒绝零假设,这意味着时间序列数据是强非平稳的。
现在,让我们尝试对log normed值运行ADF测试,并交叉检查我们的结果。
 # import python pandas package
 import pandas as pd

 # import the adfuller function from statsmodel
 # package to perform ADF test
 from statsmodels.tsa.stattools import adfuller

 # import python numpy package
 import numpy as np

# read the dataset using pandas read_csv() function
data = pd.read_csv("AirPassengers.csv", header=0, index_col=0)

# extracting only the passengers count using
# values function and applying log transform on it.
values = log(data.values)

# passing the extracted passengers count to adfuller function.
# result of adfuller function is stored in a res variable
res = adfuller(values)

# Printing the statistical result of the adfuller test
print('Augmneted Dickey_fuller Statistic: %f' % res[0])
print('p-value: %f' % res[1])

# printing the critical values at different alpha levels.
print('critical values at different levels:')
for k, v in res[4].items():
    print('\t%s: %.3f' % (k, v))
输出
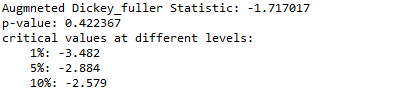
正如你所看到的,ADF测试再次显示ADF统计量在不同水平上远远大于临界值,并且p值也远远大于0.05,这意味着我们无法在90%,95%和99%的置信度下拒绝零假设,这意味着时间序列数据是强非平稳的。
因此,ADF单位根检验是检查时间序列数据是否平稳的鲁棒性检验。
感兴趣的小伙伴,赠送全套Python学习资料,包含面试题、简历资料等具体看下方。

一、Python所有方向的学习路线
Python所有方向的技术点做的整理,形成各个领域的知识点汇总,它的用处就在于,你可以按照下面的知识点去找对应的学习资源,保证自己学得较为全面。


二、Python必备开发工具
工具都帮大家整理好了,安装就可直接上手!
三、最新Python学习笔记
当我学到一定基础,有自己的理解能力的时候,会去阅读一些前辈整理的书籍或者手写的笔记资料,这些笔记详细记载了他们对一些技术点的理解,这些理解是比较独到,可以学到不一样的思路。

四、Python视频合集
观看全面零基础学习视频,看视频学习是最快捷也是最有效果的方式,跟着视频中老师的思路,从基础到深入,还是很容易入门的。

五、实战案例
纸上得来终觉浅,要学会跟着视频一起敲,要动手实操,才能将自己的所学运用到实际当中去,这时候可以搞点实战案例来学习。

六、面试宝典


简历模板
若有侵权,请联系删除


 3万+
3万+

 被折叠的 条评论
为什么被折叠?
被折叠的 条评论
为什么被折叠?
 到【灌水乐园】发言


