


项目部署:
实现原理:
看代码应该能懂。
完整代码:
'''
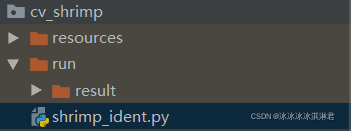
/-----resources - 存储源文件
∟run
∟result - 存储处理结果
虾苗识别 - 自动计算面积阈值
'''
import matplotlib.pyplot as plt
import numpy as np
import cv2
from tqdm import tqdm
import os
import threading
import time
# 文件重命名
def rename(prefix):
rootpath = r'resources'
files = os.listdir(rootpath)
filetype = '.jpg'
index_name = 0
for file in files:
oldname = os.path.join(rootpath, file)
num_bit = 1
index = index_name
while(index // 10 != 0):
num_bit += 1
index = index // 10
newname = os.path.join(rootpath, str(index_name).zfill(prefix)) + filetype
os.rename(oldname, newname)
print(newname)
index_name += 1
# rename(6)
class ShrimpIdent:
def __init__(self):
self.resPath = "resources"
self.relPath = "run/result"
self.filesPath = [(self.resPath + '/' + f) for f in os.listdir(self.resPath)] # 待处理图像的相对路径
self.relsPath = [(self.relPath + '/' + f) for f in os.listdir(self.resPath)] # 处理结果保存的相对路径
self.chartsPath = self.relPath + '/' + "charts.jpg"
self.charts = {}
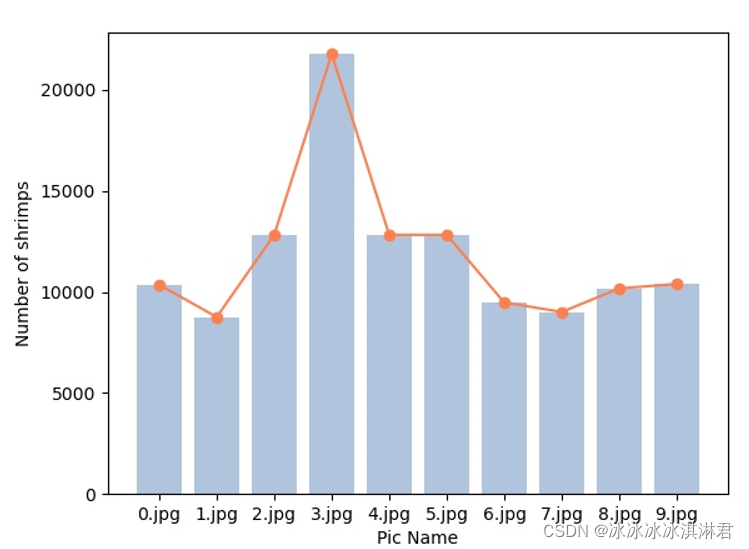
# self.charts = {'0.jpg': 10356, '1.jpg': 8755, '2.jpg': 12821, '3.jpg': 21769, '4.jpg': 12821, '5.jpg': 12821,
# '6.jpg': 9475, '7.jpg': 9006, '8.jpg': 10171, '9.jpg': 10391}
# 显示初始图像
def showOriginalImg(self, img):
cv2.imshow("win", img)
# b, g, r = cv2.split(img) # plt 输出格式
# img2 = cv2.merge([r, g, b])
# plt.imshow(img2)
# plt.show()
# 显示处理后的图像
def showProcessedImg(self, img, count):
cv2.imshow("win", img)
# b, g, r = cv2.split(img)
# img = cv2.merge([r, g, b])
# plt.imshow(img)
# plt.show()
print("count:", count)
# 计算图像阈值
def computeAreasThreshold(self, areas):
areas_set = list(set(areas))
areas_set.sort()
areas_num = []
for i in range(len(areas_set)):
if areas_set[i] == 0:
continue
areas_num.append(areas.count(areas_set[i]))
areas_thre_index = 0
areas_thre = 0
for i in range(len(areas_num)):
if areas_num[i] > max(areas_num) * 0.1:
areas_thre = i
return areas_thre
# 识别目标并计数
def computeNumberShrimp(self, pic_path):
img = cv2.imread(pic_path)
gray = cv2.cvtColor(img, cv2.COLOR_BGR2GRAY)
thre, edge = cv2.threshold(gray, 100, 255, cv2.THRESH_BINARY)
edge = 255 - edge
contours, hierarchy = cv2.findContours(edge, cv2.RETR_EXTERNAL, cv2.CHAIN_APPROX_SIMPLE)
cv2.drawContours(edge, contours, -1, (0, 0, 0xff), 5)
areas = []
for cont in contours:
area = cv2.contourArea(cont)
areas.append(area)
areas_thre = self.computeAreasThreshold(areas)
count = 0
for cont in tqdm(contours): # 进度条(tqdm)
area = cv2.contourArea(cont) # 计算包围性状的面积
if area == 0.0 or area >= areas_thre:
continue
count = count + 1
rect = cv2.boundingRect(cont) # 提取矩形坐标
cv2.rectangle(img, rect, (0, 0, 0xff), 1) # 绘制矩形
y = 10 if rect[1] < 10 else rect[1] # 防止编号到图片之外
cv2.putText(img, str(count), (rect[0], y), cv2.FONT_HERSHEY_COMPLEX, 0.4, (0, 255, 0), 1) # 在左上角写上编号
return img, count
def run(self):
stime = time.time()
self.startThread(self.filesPath, self.savefor, self.paintcharts)
etime = time.time()
s = etime - stime
m, s = divmod(s, 60)
h, m = divmod(m, 60)
print("耗时: %d:%02d:%02d" % (h, m, s))
print("END")
# 多线程(number of runs, child thread func, main thread func)
def startThread(self, nors, cthreadfunc, mthreadfunc):
pthread_list = [] # 子线程列表
for r in nors:
pthread_list.append(
threading.Thread(target=cthreadfunc, args=(r, self.relsPath[self.filesPath.index(r)],))) # 子线程调用函数
# 启动多线程
for item in pthread_list:
item.start()
flag = [1] * len(pthread_list)
while True: # 所有子线程执行结束后,再执行主线程
if sum(flag) == 0:
mthreadfunc() # 子线程结束后调用函数
break
else:
for p in pthread_list:
flag[pthread_list.index(p)] = p.isAlive()
time.sleep(2)
# 保存结果图像
def savefor(self, pic_path, rel_path):
img, count = self.computeNumberShrimp(pic_path)
self.charts.update({pic_path.split('/')[-1]: count}) # 图表参数
cv2.putText(img, str(count), (100, 100), cv2.FONT_HERSHEY_COMPLEX, 4, color=(0, 0, 255)) # 向图片中写入识别个数
cv2.imwrite(rel_path, img)
# 绘制数量统计图表
def paintcharts(self):
print("********** 打印结果 **********")
x_filename = np.array(list(self.charts.keys())) # x轴
y_count = np.array(list(self.charts.values())) # y轴
charts_size = len(x_filename)
plt.bar(range(charts_size), y_count, color='lightsteelblue')
plt.plot(range(charts_size), y_count, marker='o', color='coral')
plt.xticks(range(charts_size), x_filename)
plt.xlabel('Pic Name')
plt.ylabel("Number of shrimps")
# plt.legend()
# plt.show()
plt.savefig(self.chartsPath)
if __name__ == "__main__":
shi = ShrimpIdent()
shi.run()
# shi.paintcharts()
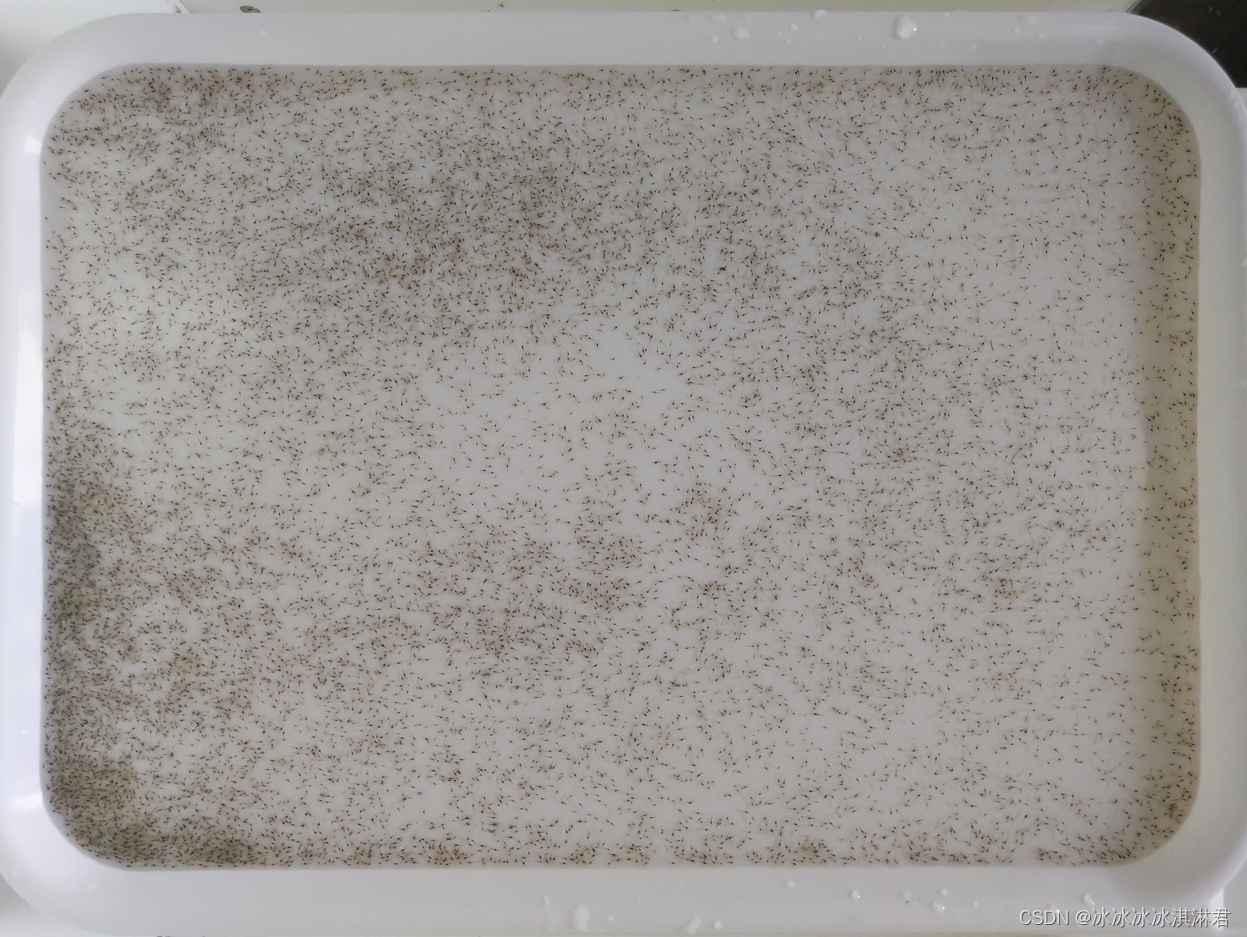
待检测图片:
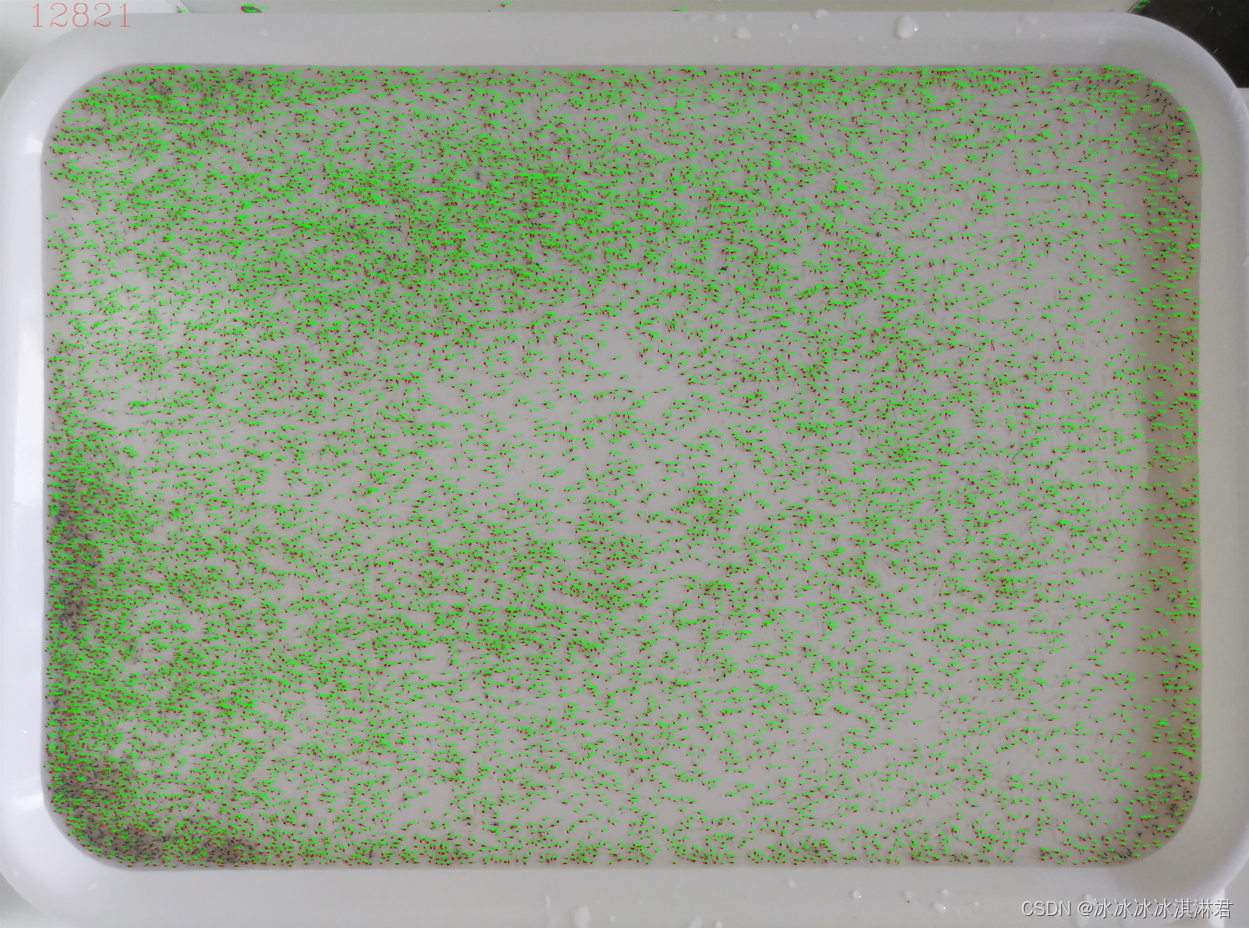
输出图片:
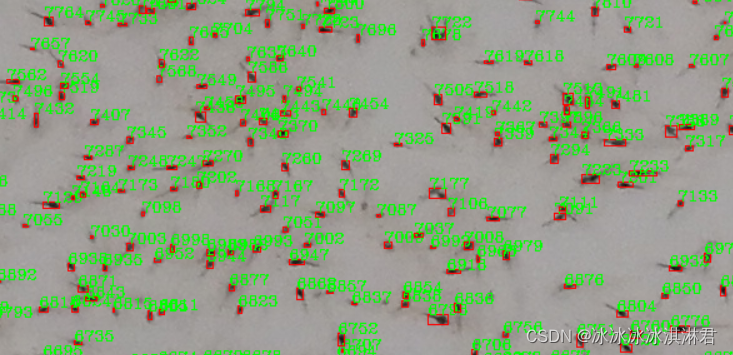
细节:
统计图:


 被折叠的 条评论
为什么被折叠?
被折叠的 条评论
为什么被折叠?
 到【灌水乐园】发言


