


 本文介绍如何使用GeoJSON数据创建地图,并展示了两种方式:一是通过`newVectorLayer`设置静态样式,二是动态通过`feature.setStyle()`调整。详细讲解了如何配置多边形区域和添加名称标签。
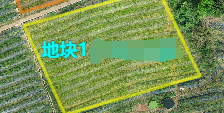
效果图:
在线预览:
方式一:
geojson数据:
geojsonData: {
        type: "FeatureCollection",
        features: [
          {
            type: "Feature",
            properties: {
              name: "地块1",
              style: {
                fill: {
                  color: "rgba(255,255,0,0.2)",
                },
                stroke: {
                  color: "rgba(255,255,0,0.6)",
                },
              },
            },
            geometry: {
              type: "MultiPolygon",
              coordinates: [
                [
                  [
                    [104.29969588135856, 30.526679760778393],
                    [104.29992193015403, 30.526209817229756],
                    [104.29919619454733, 30.526001614391873],
                    [104.29897609440422, 30.52647750659287],
                    [104.29969588135856, 30.526679760778393],
                  ],
                ],
              ],
            },
          }
        ],
      },
使用:
      this.map = new Map({
        target: "map",
        layers: [
          new VectorLayer({
            name: "dk",
            source: new VectorSource({
              features: new GeoJSON().readFeatures(this.geojsonData),
            }),
            style: function (feature) {
              return new Style({
                fill: new Fill({
                  color: feature.get("style").fill.color,
                }),
                stroke: new Stroke({
                  color: feature.get("style").stroke.color,
                  width: 3,
                }),
                text: new Text({
                  textAlign: "center",
                  textBaseline: "middle",
                  font: "bold 18px 微软雅黑",
                  text: `${feature.get("name")}`,
                  fill: new Fill({ color: "#00FFFF" }),
                  stroke: new Stroke({ color: "#353535", width: 1 }),
                }),
              });
            },
            zIndex: 999,
          }),
        ],
        view: new View({
          projection: "EPSG:4326",
          center: [104.29806, 30.5263],
          zoom: 18,
        }),
      });
方式二:
通过feature.setStyle()设置样式,通过feature.getStyle()获取样式
feature.setStyle(() => {
    return new Style({
     stroke: new Stroke({
         color: "#07B9EE",
         lineDash: [7, 10],
         width: 2
         })
    })
})


 1390
1390

 被折叠的 条评论
为什么被折叠?
被折叠的 条评论
为什么被折叠?
 到【灌水乐园】发言


