决策树
1.什么是决策树
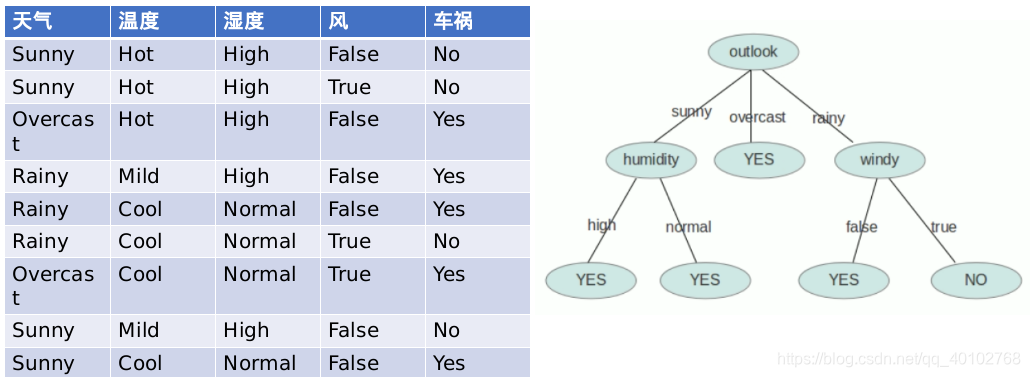
决策树是一种非线性有监督离散型分类模型
决策树是通过固定的条件来对类别进行判断:

2.决策树的生成
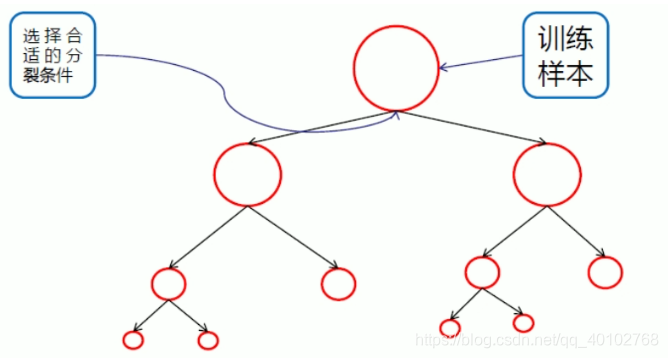
数据在不断分裂的递归过程,每一次分裂,尽可能让类别一样的数据在树的一边,当树的叶子节点的数据都是一类的时候,则停止分裂(if lese语句)

3.划分选择
决策树学习的关键,是如何选择最优划分属性,一般而言,随着划分过程不断进行,我们希望决策树的分支节点所包含的样本尽可能属于同一类别,即节点的‘纯度’越来越高。
纯度计算方式:

基尼系数,熵越大,方差越大,数据集越不一样,纯度越高
4.决策树案例(iris data)
# encoding:utf-8
import pandas as pd
import numpy as np
from sklearn.datasets import load_iris
# 决策数的分类器
from sklearn.tree import DecisionTreeClassifier
from sklearn.model_selection import train_test_split
from sklearn.metrics import accuracy_score
import matplotlib.pyplot as plt

iris = load_iris()
data = pd.DataFrame(iris.data)
data.columns = iris.feature_names
data['Species'] = iris.target
print(data)

# 花萼长度和宽度
x = data.iloc[:, :2]
y = data.iloc[:, -1]

# 对数据集进行切分
# 相同的随机种子产生的随机数是一样
# 不同的随机种子产生的随机数不一样
x_train, x_test, y_train, y_test = train_test_split(x, y, train_size=0.75, random_state=42)

# 创建一个决策数的模型
tree_clf = DecisionTreeClassifier(max_depth=4, criterion='entropy')
tree_clf.fit(x_train, y_train)
y_test_hat = tree_clf.predict(x_test)
print("acc score:", accuracy_score(y_test, y_test_hat))

depth = np.arange(1, 15)
err_list = []

"""
splitter: 分裂的方式
             best   找最好的维度进行分裂
             random 随机找维度进行分裂
feature: splitter方法中,找best分割维度的时候,需要在多少个维度中找那个最好的
            none 就是不限制找的数量
            int 就是找n个数进行考量
            float就是找0.5(50%)去试
            sqrt就是找所有特征数开根号个特征
max_depth: 树分裂的最大深度 none
min_sample_split:分裂前我需要保证这个叶子有几个样本
                      int就是要保证叶子里的样本数大于n,
                      float 就是要保证叶子里的样本数大于某个百分比
min_sample_leaf: 分裂后需要保证每个分裂的叶子有几个样本
min_weight_fraction_leaf:每个叶子节点里的样本数,必须是所有样本的10%
max_leaf_nodes:最多的叶子数
min_impurity_split:每个叶子节点里的不纯度,这个参数是为了保证树不会过早的停止生长;达不到指标就会继续往下分裂
"""

for d in depth:
    clf = DecisionTreeClassifier(criterion='entropy', max_depth=d)
    clf.fit(x_train, y_train)
    y_test_hat = clf.predict(x_test)
    result = (y_test_hat == y_test)
    err = 1 - np.mean(result)
    err_list.append(err)
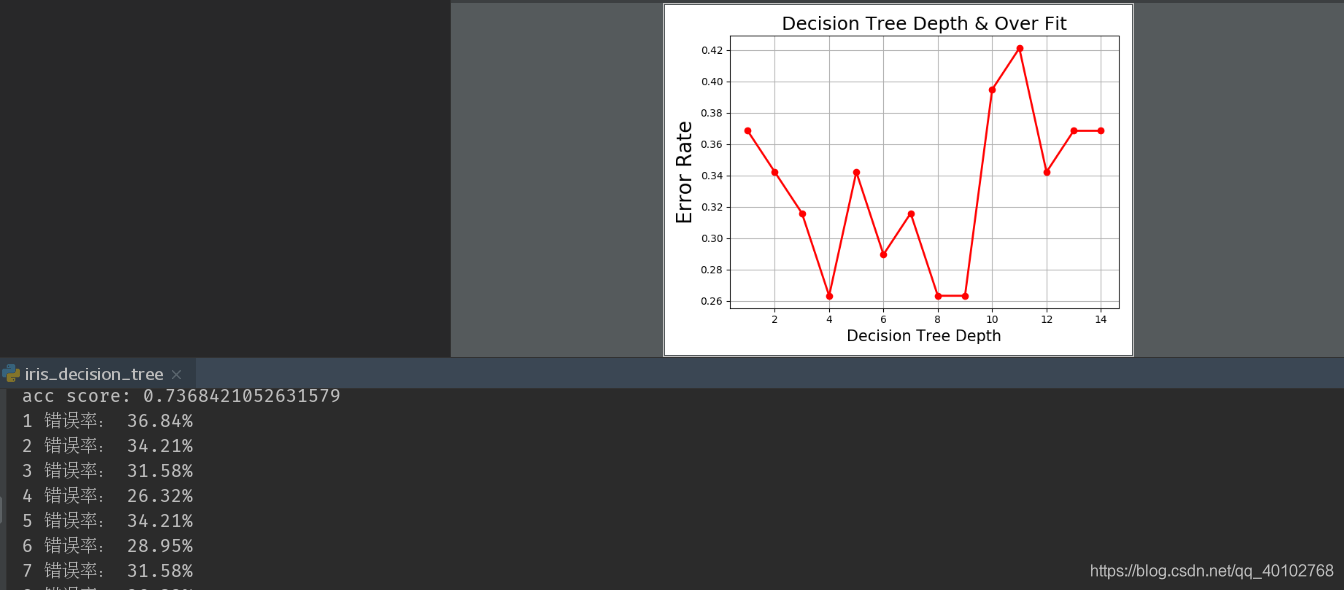
    print(d, '错误率: %.2f%%' % (100 * err))

plt.figure(facecolor='w')
plt.plot(depth, err_list, 'ro-', lw=2)
plt.xlabel('Decision Tree Depth', fontsize=15)
plt.ylabel('Error Rate', fontsize=15)
plt.title('Decision Tree Depth & Over Fit', fontsize=18)
plt.grid(True)
plt.show()

5.决策树做回归
代码实现:
import numpy as np
from sklearn.tree import DecisionTreeRegressor
import matplotlib.pyplot as plt
N = 100
x = np.random.rand(N) * 6 - 3
x.sort()

y = np.sin(x) + np.random.rand(N) * 0.05
x = x.reshape(-1, 1)

dt_reg = DecisionTreeRegressor(criterion='mse', max_depth=3)
dt_reg.fit(x, y)

x_test = np.linspace(-3, 3, 50).reshape(-1, 1)
y_hat = dt_reg.predict(x_test)


plt.plot(x, y, "y*", label="actual")
plt.plot(x_test, y_hat, "b-", linewidth=2, label="predict")
plt.legend(loc="upper left")
plt.grid()
plt.show()

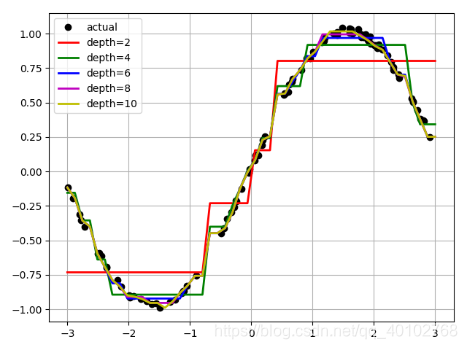
depth = [2, 4, 6, 8, 10]
color = 'rgbmy'
dt_reg = DecisionTreeRegressor()
plt.plot(x, y, 'ko', label='actual')
x_test = np.linspace(-3, 3, 50).reshape(-1, 1)
for d, c in zip(depth, color):
    dt_reg.set_params(max_depth=d)
    dt_reg.fit(x, y)
    y_hat = dt_reg.predict(x_test)
    plt.plot(x_test, y_hat, '-', color=c, linewidth=2, label='depth=%d' % d)
plt.legend(loc="upper left")
plt.grid(b=True)
plt.show()


 本文深入解析决策树模型,包括其工作原理、生成过程、划分选择标准及应用案例。通过实例展示决策树在分类与回归任务中的表现,并探讨了模型参数对过拟合的影响。


 1404
1404

 被折叠的 条评论
为什么被折叠?


