


 这篇博客介绍了HTML5 Canvas的基础用法,包括绘制路径、矩形、圆弧和文字。讲解了如何使用JavaScript在canvas上进行图像绘制,如设置线条颜色、渐变填充,以及绘制自定义折线图和圆弧的方法。同时,提到了非零填充规则和面向对象编程在canvas应用中的体现。
H5之canvas学习
- canvas画布的作用: HTML5 的 canvas 元素使用 JavaScript 在网页上绘制图像。
画布是一个矩形区域,您可以控制其每一像素。
canvas 拥有多种绘制路径、矩形、圆形、字符以及添加图像的方法。
绘制路径
- 画布的尺寸不应该在样式设置需要,利用内联的方式设置
- 起始moveTo(),结束LineTo(),描边stroke(),函数的运用, item对于线条的绘画主要是对点的确定是关键 还可以利用strokeColor设置颜色
- 对于闭合 分为手动闭合和自动闭合
手动闭合:将点都描绘出来,然后利用fill()进行填充
自动闭合:closePath(); - 填充规则:非零填充,利用非零填充可以实现颜色的不同实现

- 颜色的渐变可以利用填充时实现(线是由点构成)ctx.lineWidth =30;
ctx.moveTo(100,100);
for(var i=0;i<255;i++){
ctx.beginPath();
ctx.moveTo(100+i-1,100);
ctx.lineTo(100+i,100);
ctx.strokeStyle = ‘rgb(’+i+’,’+i+’,’+i+’)’;
ctx.stroke();
}
绘制矩形
- Rect()用于绘制矩形,矩形需要计算中心点和四边点之间的关系,然后进行绘制
- 渐变矩形,利用下面一段代码可以实现渐变`var linearGradient = ctx.createLinearGradient(100,100,500,100);
linearGradient.addColorStop(0,‘pink’);
linearGradient.addColorStop(0.5,‘red’);
linearGradient.addColorStop(1,‘blue’);
ctx.fillStyle = linearGradient;
ctx.fillRect(100,100,400,100);
利用绘制线段的方法可以绘制一个属于自己的这折线图
<!DOCTYPE html>
<html lang="en">
<head>
    <meta charset="UTF-8">
    <title>Title</title>
    <style>
        canvas{
            border: 1px solid #cccccc;
            /*不建议 在样式中设置尺寸*/
        }
    </style>
</head>
<body>
<!--1.准备画布 -->
<canvas width="600" height="400"></canvas>
<script>
   /*1.构造函数*/
   var LineChart = function (ctx) {
    /*获取绘图工具*/
    this.ctx = ctx  || document.querySelector('canvas').getContext('2d');
    /*画布的大小*/
    this.canvasWidth = this.ctx.canvas.width;
    this.canvasHeight = this.ctx.canvas.height;
    /*网格的大小*/
    this.gridSize = 10;
    /*坐标系的间距*/
    this.space = 20;
    /*坐标原点*/
    this.x0 = this.space;
    this.y0 = this.canvasHeight-this.space;
    /*箭头的大小*/
    this.arrowSize = 10;
    /*绘制点*/
    this.dottedSize = 6;
    /*点的坐标 和数据有关系 数据可视化*/

   }
   /*2.行为方法*/
   LineChart.prototype.init =function (data) {
       this.drawGrid();
       this.drawAxis();
       this.drawDotteds(data);

   }
   /*绘制网格*/
   LineChart.prototype.drawGrid = function () {
       /*x方向的线*/
       var xLineTotal = Math.floor(this.canvasHeight/this.gridSize);
       for(var i = 0;i <= xLineTotal; i++){
           this.ctx.beginPath();
           this.ctx.moveTo(0,i*this.gridSize);
           this.ctx.lineTo(this.canvasWidth,i*this.gridSize - 0.5);
           this.ctx.strokeStyle = '#555';
           this.ctx.stroke();
       }
       /*y方向的线*/
       var yLineTotal = Math.floor(this.canvasWidth/this.gridSize+0.5);
       for(var i = 0;i <= yLineTotal; i++){
           this.ctx.beginPath();
           this.ctx.moveTo(i*this.gridSize-0.5,0);
           this.ctx.lineTo(i*this.gridSize-0.5,this.canvasHeight);
           this.ctx.strokeStyle = '#555';
           this.ctx.stroke();
       }
   }
   /*绘制坐标系*/
   LineChart.prototype.drawAxis = function () {
       /*x轴绘制*/
       this.ctx.beginPath();
       this.ctx.strokeStyle = '#000';
       this.ctx.moveTo(this.x0,this.y0);
       this.ctx.lineTo(this.canvasWidth-this.space,this.y0);
       this.ctx.lineTo(this.canvasWidth- this.space-this.arrowSize,this.y0+this.arrowSize/2);
       this.ctx.lineTo(this.canvasWidth - this.space -this.arrowSize,this.y0-this.arrowSize/2);
       this.ctx.lineTo(this.canvasWidth - this.space,this.y0);
       this.ctx.stroke();
       this.ctx.fill();

       /*y轴绘制*/
       this.ctx.beginPath();
       this.ctx.strokeStyle = '#000';
       this.ctx.moveTo(this.x0,this.y0);
       this.ctx.lineTo(this.space,this.space);
       this.ctx.lineTo(this.space+this.arrowSize/2,this.space+this.arrowSize);
       this.ctx.lineTo(this.space -this.arrowSize/2,this.space+this.arrowSize);
       this.ctx.lineTo(this.space,this.space);;
       this.ctx.stroke();
       this.ctx.fill();

   }
   /*绘制所有点*/
   LineChart.prototype.drawDotteds = function (data) {
       /*1.数据的坐标需要转化为canvas坐标*/
       /*2.再进行点的绘制*/
       /*3.把线连起来*/
       //防止this的指向问题
       var that = this;
       /*记录当前坐标*/
       var prevCanvasX = 0;
       var prevCanvasY = 0;
       data.forEach(function (item,i) {
           /*x = */
          var  canvasX = that.x0 + item.x;
          var  canvasY = that.y0 - item.y;
          /*绘制点*/
          that.ctx.beginPath();
          that.ctx.strokeStyle = 'red';
          that.ctx.moveTo(canvasX-that.dottedSize/2,canvasY-that.dottedSize/2);
          that.ctx.lineTo(canvasX+that.dottedSize/2,canvasY - that.dottedSize/2);
          that.ctx.lineTo(canvasX+that.dottedSize/2,canvasY + that.dottedSize/2);
          that.ctx.lineTo(canvasX-that.dottedSize/2,canvasY + that.dottedSize/2);
          that.ctx.closePath();
          that.ctx.fill();
          /*点的连线*/
          /*当点不是第一个点的时候起点是x0,y0*/
          /*当时不是第一点的时候起点是上一个点*/
          if(i == 0)
          {
              that.ctx.beginPath();
              that.ctx.moveTo(that.x0,that.y0);
              that.ctx.lineTo(canvasX,canvasY);
              that.ctx.stroke();
          }else {
              /*上一个点*/
              that.ctx.beginPath();
              that.ctx.moveTo(prevCanvasX,prevCanvasY);
              that.ctx.lineTo(canvasX,canvasY);
              that.ctx.stroke();
          }
          /*记录当前的坐标,下次要用*/
          prevCanvasX = canvasX;
          prevCanvasY = canvasY;

       });
   }
   /*3.初始化*/
   var data = [
        {
        x:100,
        y:120
    },
        {
            x:200,
            y:160
        },
        {
            x: 300,
            y: 240
        },
        {
            x: 400,
            y: 240
        },
        {
            x:500,
            y:80
        }
    ];
     var chart = new LineChart();
     chart.init(data);
</script>
</body>
</html>
- 折线图的编写:主要考察了canvas画布的函数和对象函数的运用和考察面向对象的编程能力的体现,还有就是数学计算能力的体现,js中的对象是通过构造函数实现
绘制圆弧
- act()函数进行绘制,关键在于圆弧和角度之间的关系
角度=Math.PI.2弧长
绘制文字
- 文字主要就是对几个函数的理解参考MDA文档
Canvas_API
最后是按照别人的做的一个案例
<!DOCTYPE html>
<html lang="en">
<head>
<meta charset="UTF-8">
<title>Title</title>
<style>
canvas{
border: 1px solid #cccccc;
}
</style>
</head>
<body>
<!--1.准备画布 -->
<canvas width="800" height="400"></canvas>
</body>
<script>
console.log(111);
var myCanvas = document.querySelector('canvas');
var ctx = myCanvas.getContext('2d');
console.log('aaa');
/*需要的变量参数*/
/*数量总数*/
var total =0
/*圆心的确定*/;
var w = ctx.canvas.width;
var h = ctx.canvas.height;
var x0 = w/2;
var y0 = h/2;
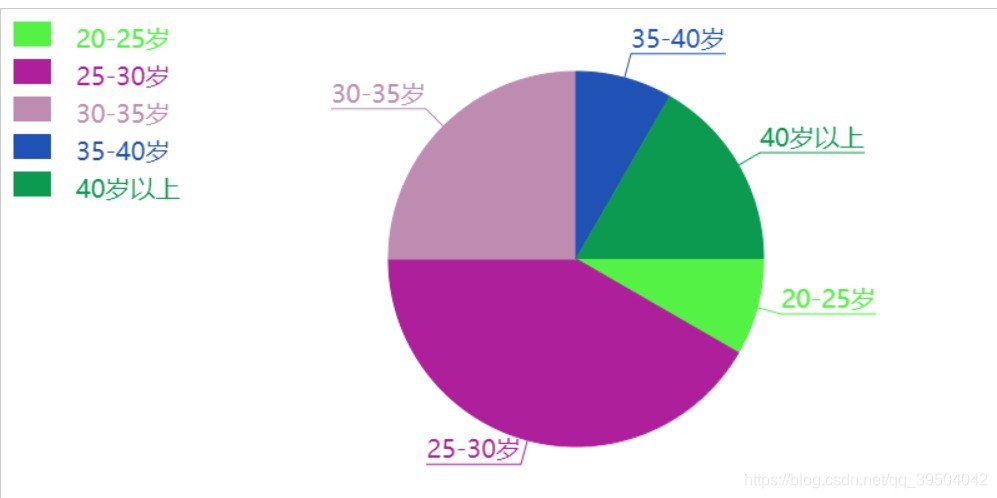
/*1.绘制饼状图*/
/*1.1 根据数据绘制一个饼图*/
/*1.2 绘制标题 从扇形的弧中心伸出一条线在画一条横线的上面写上文字标题*/
/*1.3 在画布的左上角 绘制说明 一个和扇形一样颜色的矩形 旁边就是文字说明*/
var PieChar =function (ctx) {
this.ctx =ctx || document.querySelector('canvas').getContext('2d');
//console.log(ctx);
/*绘制饼图的中心*/
this.w =this.ctx.canvas.width;
this.h = this.ctx.canvas.height;
/*圆心*/
this.x0 = this.w/2 + 60;
this.y0 = this.h/2;
/*半径*/
this.radius = 150;
/*出去的长度*/
this.outline = 20;
/*说明矩形的大小*/
this.rectW = 30;
this.rectH = 20;
this.space = 10;
};
PieChar.prototype.init = function (data)
{
/*1.准备数据*/
this.drawPie(data);
/*2.转化弧度*/
};
PieChar.prototype.drawPie =function (data) {
var that = this;
/*1.转化弧度*/
var angleLiset = this.transformAngle(data);
/*2.绘制饼图*/
var startAngle = 0;
angleLiset.forEach(function (item,i) {
/*当前的结束弧度等于下次的起始弧度*/
var endAngle = startAngle + item.angle;
var titleColor = '';
ctx.beginPath();
ctx.moveTo(that.x0,that.y0);
ctx.arc(that.x0,that.y0,that.radius,startAngle,endAngle);
titleColor = that.getAngleColor();
ctx.fillStyle =titleColor;
ctx.fill();
/*绘制标题*/
that.drawTitle(startAngle,item.angle,titleColor,item.title,item);
/*绘制说明*/
that.drawDesc(i,item.title);
/*下一次要使用当前的这一次的结束角度*/
startAngle = endAngle;
})
};
PieChar.prototype.drawTitle = function (startAngle,angle,titleColor,title) {
/*1.确定伸出去的线 通过圆心点 通过伸出去的点 确定这条线*/
/*2.确定伸出去的点 需要确定伸出的线的长度*/
/*3.固定伸出去的线的长度*/
/*4.计算这个点的坐标*/
/*5.需要根据角度和斜边的长度*/
/*5.1 使用弧度 当前扇形的起始弧度 +对应的弧度的一半*/
/*5.2 半径+伸出去的长度*/
/*5.3 outx = x0 + cos(angle)*(r + outline) */
/*5.3 outy = y0 + sin(angle)*(r + outline) */
/*斜边*/
var edge = this.radius + this.outline;
/*x轴上的直角边*/
var edgeX = Math.cos(startAngle + angle / 2) * edge;
/*y轴上的直角边*/
var edgeY = Math.sin(startAngle + angle / 2) * edge;
/*计算出去的点坐标*/
var outX = this.x0 + edgeX;
var outY = this.y0 + edgeY;
this.ctx.moveTo(this.x0, this.y0);
this.ctx.lineTo(outX,outY);
this.ctx.strokeStyle = titleColor;
/*画文字和下划线*/
/*线的方向怎么判断 伸出去的点在x0的左边 线的方向就是左边*/
/*线的方向怎么判断 伸出去的点在x0的右边 线的方向就是右边*/
/*结束的点坐标和文字的大小*/
this.ctx.font = '20px Microsoft YaHei';
var textWidth = this.ctx.measureText(title).width;
if (outX > this.x0)
{
this.ctx.lineTo(outX+textWidth,outY);
this.ctx.textAlign = 'left';
}else {
this.ctx.lineTo(outX-textWidth,outY);
this.ctx.textAlign = 'right';
}
this.ctx.stroke();
this.ctx.textBaseline = 'bottom';
/*添加在这里会出现问题*/
//this.ctx.font = '20px Microsoft YaHei';
this.ctx.fillText(title,outX,outY);
};
PieChar.prototype.drawDesc = function (i,title) {
/*绘制说明*/
/*矩形的大小*/
/*距离上和左边的间距*/
/*矩形之间的间距*/
/*绘制矩形*/
this.ctx.fillRect(this.space,this.space + i*(this.rectH + this.space),this.rectW,this.rectH);
/*绘制文字 需要重新绘制,不然会出现问题*/
this.ctx.beginPath();
this.ctx.textBaseline = 'top';
this.ctx.textAlign = 'left';
this.ctx.fillText(title,this.space+this.rectW+20,this.space + i*(this.rectH + this.space));
};
PieChar.prototype.transformAngle = function (data) {
/*返回的数据内包含弧度*/
data.forEach(function (item, i) {
total += item.num;
});
PieChar.prototype.getAngleColor =function () {
var r =Math.floor(Math.random()*256);
var g =Math.floor(Math.random()*256);
var b =Math.floor(Math.random()*256);
return 'rgb('+r+','+g+','+b+')';
};
/*计算弧度,并且追加到当前的对象内容中*/
data.forEach(function (item, i) {
var angle = item.num / total * Math.PI * 2;
item.angle = angle;
});
//console.log(data);
return data;
}
var data =[{
title:'20-25岁',
num:5
},
{
title:'25-30岁',
num:25
},
{
title:'30-35岁',
num:15
},
{
title:'35-40岁',
num:5
},
{
title:'40岁以上',
num:10
}];
var pieChar = new PieChar();
pieChar.init(data);
</script>
</html>
格言:代码一遍不懂就两遍,我待代码如初恋;


 1232
1232

 被折叠的 条评论
为什么被折叠?
被折叠的 条评论
为什么被折叠?
 到【灌水乐园】发言


