


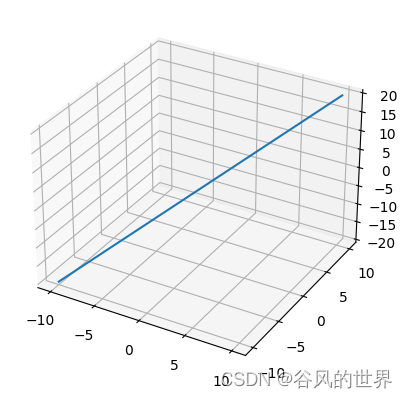
一、绘制线形图
Axes3D.plot 函数用来绘制线形图。
import matplotlib.pyplot as plt
import numpy as np

from mpl_toolkits.mplot3d import Axes3D

fig = plt.figure()
ax = fig.add_subplot(projection='3d')

x = np.linspace(-10, 10, 1000)
y = np.linspace(-10, 10, 1000)
z = np.add(x, y)

ax.plot(x, y, z)
plt.show()
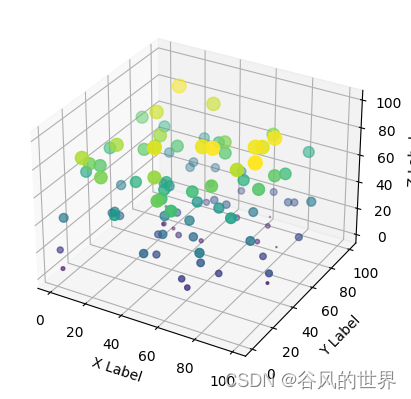
二、散点图
Axes3D.scatter 函数用来绘制散点图。
import matplotlib.pyplot as plt
import numpy as np

from mpl_toolkits.mplot3d import Axes3D

fig = plt.figure()
ax = fig.add_subplot(projection='3d')

count = 100
range1 = 100

xs = np.random.rand(count) * range1
ys = np.random.rand(count) * range1
zs = np.random.rand(count) * range1

ax.scatter(xs, ys, zs, s=zs, c=zs)

ax.set_xlabel('X Label')
ax.set_ylabel('Y Label')
ax.set_zlabel('Z Label')

plt.show()
三、线框图
Axes3D.plot_wireframe 函数用来绘制线框图。
# meshgrid_demo.py

import numpy as np

x = np.arange(1, 4)
y = np.arange(11, 16)
print(x)
print(y)

X, Y = np.meshgrid(x, y)
print(X)
print(Y)
[1 2 3]
[11 12 13 14 15]
[[1 2 3]
 [1 2 3]
 [1 2 3]
 [1 2 3]
 [1 2 3]]
[[11 11 11]
 [12 12 12]
 [13 13 13]
 [14 14 14]
 [15 15 15]]
import matplotlib.pyplot as plt
import numpy as np

from mpl_toolkits.mplot3d import Axes3D

fig = plt.figure()
ax = fig.add_subplot
最低0.47元/天 解锁文章


 875
875

 被折叠的 条评论
为什么被折叠?
被折叠的 条评论
为什么被折叠?
 到【灌水乐园】发言


