


 本文介绍了如何在Java Web应用中使用JFreeChart库来创建饼状图、折线图和柱状图。提供了具体的代码示例,包括创建数据集、设置图表样式以及显示图表的方法。饼状图通过`Bzt`工具类创建,折线图通过`Zxt`工具类创建,柱状图通过`Tzt`工具类创建。这些工具类中包含了设置图表标题、轴标签、样式和数据的方法。示例代码展示了如何从数据源获取数据并转换为图表所需格式。
1.只需要引入三个jar包如下图
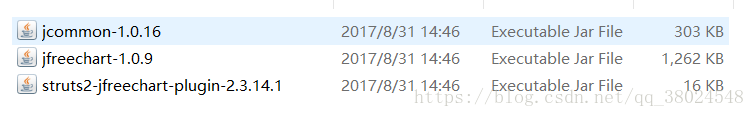
然后分别有已经写好的三个绘制工具类
1.饼状图代码
package com.lisheng.util;
import java.awt.Font;
import java.text.DecimalFormat;
import java.util.Iterator;
import java.util.Map;
import java.util.Set;import org.jfree.chart.ChartFactory;
import org.jfree.chart.JFreeChart;
import org.jfree.chart.labels.StandardPieSectionLabelGenerator;
import org.jfree.chart.plot.PiePlot;
import org.jfree.chart.plot.PiePlot3D;
import org.jfree.data.general.DefaultPieDataset;
import org.jfree.util.Rotation;public class Bzt
{/**
* 创建饼状图
*
* @param title
* 标题
* @param map
* 键值对(水果名称 水果数量)
* @return
*/
public static JFreeChart createPieChart(String title, Map map)
{
DefaultPieDataset dpd = createPieDataset(map);
// 创建PieChart对象(标题,数据集,是否显示图例,是否生成工具提示,是否生成URL链接)
JFreeChart chart = ChartFactory.createPieChart3D(title, dpd, true,true,false);
setPie3DStyle(chart);
return chart;
}/**
* 创建饼状图数据
*
* @param map
* @return
*/
private static DefaultPieDataset createPieDataset(Map map)
{
DefaultPieDataset dpd = new DefaultPieDataset();
Set<String> set = map.keySet();
for (Iterator<String> itor = set.iterator(); itor.hasNext();)
{
String key = itor.next();
double x = Double.parseDouble(map.get(key).toString());
dpd.setValue(key, x);
}
return dpd;
}
/**
* 设置饼状图3D样式
*
* @param chart
*/
private static void setPie3DStyle(JFreeChart chart)
{
// 获得3D的水晶饼图对象
PiePlot3D pieplot3d = (PiePlot3D) chart.getPlot();
// 设置开始角度
pieplot3d.setStartAngle(150D);
// 设置方向为”顺时针方向“
pieplot3d.setDirection(Rotation.CLOCKWISE);
&nb
 最低0.47元/天 解锁文章


 1364
1364

 被折叠的 条评论
为什么被折叠?
被折叠的 条评论
为什么被折叠?
 到【灌水乐园】发言


