


# 计算方式,将prob从大到排列,prob = [0.9,0.8,0.7,0.3,0.2],对应
# truth=[1,1,0,1,1],然后取prob的第一个元素到最后一个元素作为阀值,
# 当大于这个阀值为正样本否则为负样本(如取0.9,则pred=[0,0,0,0,0]),
# 构建混淆矩阵 计算 tpr = tp/(tp+fn) 和 fpr = fp/(fp+tn)
from sklearn.metrics import roc_curve, auc, mean_squared_error, accuracy_score
def check_fit(truth, prob):
"""
truth: 真实的值 [1,0,1,1,1]
prob: 预测的值 [0.9,0.7,0.8,0.2,0.3]
"""
fpr, tpr, _ = roc_curve(truth, prob) # drop_intermediate:(default=True)
roc_auc = auc(fpr, tpr) # 计算auc值,roc曲线下面的面积 等价于 roc_auc_score(truth,prob)
plt.figure()
plt.plot(fpr, tpr, color='darkorange', lw=2, label='ROC curve (area = %0.2f)' % roc_auc)
plt.plot([0, 1], [0, 1], color='navy', lw=2, linestyle='--')
plt.xlim([-0.1, 1.05])
plt.ylim([-0.1, 1.05])
plt.xlabel('False Positive Rate')
plt.ylabel('True Positive Rate')
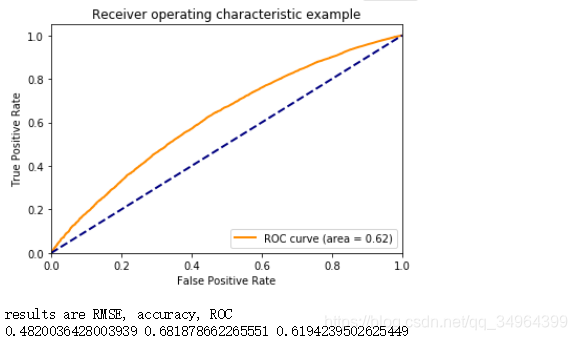
plt.title('Receiver operating characteristic example')
plt.legend(loc="lower right")
plt.show()
print('results are RMSE, accuracy, ROC')
predics = [1 if i>=0.5 else 0 for i in prob]
print(math.sqrt(mean_squared_error(truth, prob)), accuracy_score(truth, predics), roc_auc)
画出来的图类似于下面的。
需要注意的是: 计算fpr和tpr时候, 参数drop_intermediate若默认,则会去除掉一些值
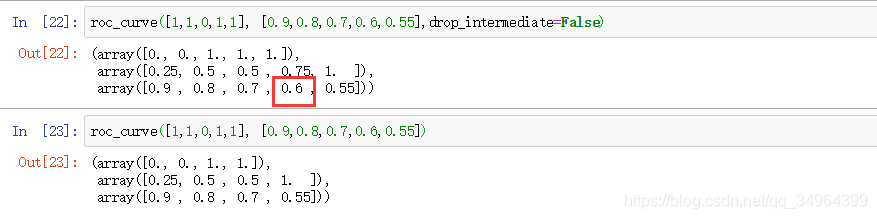
drop_intermediate : boolean, optional (default=True)
Whether to drop some suboptimal thresholds which would not appear
on a plotted ROC curve. This is useful in order to create lighter
ROC curves.


 399
399

 被折叠的 条评论
为什么被折叠?
被折叠的 条评论
为什么被折叠?
 到【灌水乐园】发言


