


elk(都是6.2.4重点-版本2-收集系统和tomcat日志(单点es,redis缓存)-filebeat
如果对运维课程感兴趣,可以在b站上、A站或csdn上搜索我的账号: 运维实战课程,可以关注我,学习更多免费的运维实战技术视频
1.搭建elk6.2.4环境(cent7.4),logstash收集tomcat和系统日志写入es(用redis解耦操作)
规划: 192.168.171.128: es
192.168.171.129: filebeat 和测试日志文件(tomcat的java日志文件和系统日志文件) filebeat将日志数据写入redis
192.168.171.130: nginx+kibana(nginx使得kibana能用用户和密码认证登录)
192.168.171.131: redis 和logstash2 logstash2将日志数据从redis读出,写入es中
1)在192.168.171.128上:安装elasticsearch:
a)环境准备
[root@bogon ~]# vim /etc/security/limits.conf
* soft nofile 65536 #注意必须是65536以上,65535都不行
* hard nofile 65536
* soft nproc 4096
* hard nproc 4096
[root@bogon ~]# vim /etc/security/limits.d/20-nproc.conf
* soft nproc 4096 #至少是4096,若小于则需修改,也可大于4096
[root@bogon ~]# vim /etc/sysctl.conf
vm.max_map_count=262144 #添加,至少是262144
[root@bogon ~]# sysctl -p
[root@bogon ~]# reboot
[root@bogon ~]# systemctl stop firewalld.service
b)安装jdk1.8:
[root@bogon ~]# mkdir /usr/local/java
[root@bogon ~]# rz
上传jdk1.8包
[root@bogon ~]# ls
jdk-8u144-linux-x64.tar.gz
[root@bogon ~]# tar -zxf jdk-8u144-linux-x64.tar.gz
[root@bogon ~]# ls
jdk1.8.0_144 jdk-8u144-linux-x64.tar.gz
[root@bogon ~]# mv jdk1.8.0_144/ /usr/local/java/
[root@bogon ~]# ls /usr/local/java/
jdk1.8.0_144
[root@bogon ~]# vim /etc/profile
#最后面添加:
JAVA_HOME=/usr/local/java/jdk1.8.0_144
CLASSPATH=.:$JAVA_HOME/jre/lib/rt.jar:$JAVA_HOME/lib/dt.jar:$JAVA_HOME/lib/tools.jar
PATH=$JAVA_HOME/bin:$PATH
export JAVA_HOME CLASSPATH PATH
[root@bogon ~]# source /etc/profile
[root@bogon ~]# java -version
java version "1.8.0_144"
Java(TM) SE Runtime Environment (build 1.8.0_144-b01)
Java HotSpot(TM) 64-Bit Server VM (build 25.144-b01, mixed mode)
[root@bogon ~]# rz
上传elasticsearch包,并安装elasticsearch,(es启动需要普通用户,其他服务启动用root)
[root@bogon ~]# ls
elasticsearch-6.2.4.tar.gz jdk-8u144-linux-x64.tar.gz
[root@bogon ~]# tar -zxf elasticsearch-6.2.4.tar.gz
[root@bogon ~]# ls
elasticsearch-6.2.4 elasticsearch-6.2.4.tar.gz jdk-8u144-linux-x64.tar.gz
[root@bogon ~]# mv elasticsearch-6.2.4 /opt/
[root@bogon ~]# ls /opt/elasticsearch-6.2.4/
bin config lib LICENSE.txt logs modules NOTICE.txt plugins README.textile
[root@bogon ~]# groupadd eszu
[root@bogon ~]# useradd esyonghu -g eszu -p 123456
[root@bogon ~]# chown -R esyonghu:eszu /opt/elasticsearch-6.2.4/
[root@bogon ~]# su - esyonghu
[esyonghu@bogon ~]$ vim /opt/elasticsearch-6.2.4/config/elasticsearch.yml
network.host: 192.168.171.128 #修改,本机ip,或者0.0.0.0,监听本机所有ip
http.port: 9200 #释放
[esyonghu@bogon ~]$ cd /opt/elasticsearch-6.2.4/bin/
[esyonghu@bogon bin]$ ls elasticsearch
elasticsearch
[esyonghu@bogon bin]$ ./elasticsearch -d #后台启动es,或者先./ elasticsearch前台启动查看下是否能启动再后台启动
[esyonghu@bogon bin]$ tailf /opt/elasticsearch-6.2.4/logs/elasticsearch.log #查看启动日志,有时需要等会才能形成日志
………
[2019-10-12T21:27:15,635][INFO ][o.e.c.s.ClusterApplierService] [koccs5f] new_master {koccs5f}{koccs5fwSre801IprBSrzw}{A-z15PqtRByWA494KhVH_A}{192.168.171.128}{192.168.171.128:9300}, reason: apply cluster state (from master [master {koccs5f}{koccs5fwSre801IprBSrzw}{A-z15PqtRByWA494KhVH_A}{192.168.171.128}{192.168.171.128:9300} committed version [1] source [zen-disco-elected-as-master ([0] nodes joined)]])
[2019-10-12T21:27:15,743][INFO ][o.e.h.n.Netty4HttpServerTransport] [koccs5f] publish_address {192.168.171.128:9200}, bound_addresses {192.168.171.128:9200}
[2019-10-12T21:27:15,744][INFO ][o.e.n.Node ] [koccs5f] started
[2019-10-12T21:27:15,746][INFO ][o.e.g.GatewayService ] [koccs5f] recovered [0] indices into cluster_state
[esyonghu@bogon bin]$ netstat -anput |grep 9200
有9200端口
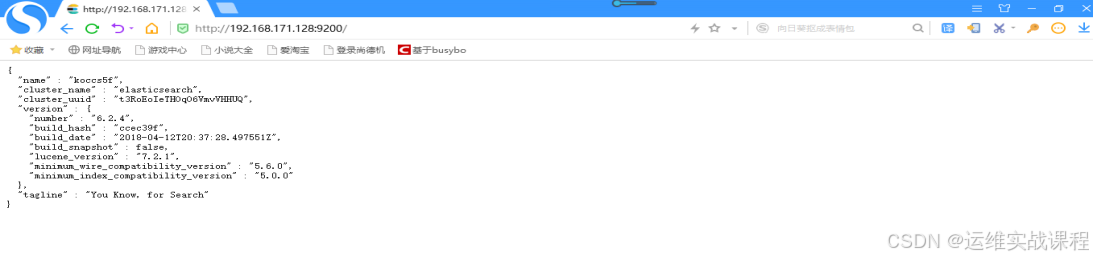
[esyonghu@bogon bin]$ curl http://192.168.171.128:9200
能访问es默认页面
客户端浏览器外网访问,如下:http://192.168.171.128:9200/

c)elasticsearch安装head插件:是es的一个客户端管理工具(es5.0版本后,head插件独立安装)
安装nodejs环境: (head插件会用到grunt,而grunt需要npm包管理器,所以需要安装nodejs环境)
另开一个窗口,用root用户,也可用其他用户
[root@bogon ~]# rz
上传nodejs包
[root@bogon ~]# ls
elasticsearch-6.2.4.tar.gz jdk-8u144-linux-x64.tar.gz node-v9.6.1-linux-x64.tar.xz
[root@bogon ~]# xz -d node-v9.6.1-linux-x64.tar.xz
[root@bogon ~]# ls
elasticsearch-6.2.4.tar.gz jdk-8u144-linux-x64.tar.gz node-v9.6.1-linux-x64.tar
[root@bogon ~]# tar -xf node-v9.6.1-linux-x64.tar
[root@bogon ~]# ls
elasticsearch-6.2.4.tar.gz jdk-8u144-linux-x64.tar.gz node-v9.6.1-linux-x64 node-v9.6.1-linux-x64.tar
[root@bogon ~]# mv node-v9.6.1-linux-x64 /opt/
[root@bogon ~]# ls /opt/node-v9.6.1-linux-x64/
bin CHANGELOG.md include lib LICENSE README.md share
[root@bogon ~]# export PATH=$PATH:/opt/node-v9.6.1-linux-x64/bin
[root@bogon ~]# echo "export PATH=$PATH:/opt/node-v9.6.1-linux-x64/bin" >> /etc/profile
[root@bogon ~]# tail -1 /etc/profile
export PATH=/usr/local/sbin:/usr/local/bin:/usr/sbin:/usr/bin:/root/bin:/opt/node-v9.6.1-linux-x64/bin:/opt/node-v9.6.1-linux-x64/bin
[root@bogon ~]# source /etc/profile
[root@bogon ~]# node -v
v9.6.1
[root@bogon ~]# npm -v
5.6.0
[root@bogon ~]# npm install -g grunt-cli #安装head插件依赖工具
[root@bogon ~]# grunt --version
grunt-cli v1.3.2
从github删下载head插件,也可先下载后,保留存起来
[root@bogon ~]# yum -y install git
[root@bogon ~]# git clone git://github.com/mobz/elasticsearch-head.git
[root@bogon ~]# ls
elasticsearch-6.2.4.tar.gz elasticsearch-head jdk-8u144-linux-x64.tar.gz node-v9.6.1-linux-x64.tar
[root@bogon ~]# mv elasticsearch-head/ /opt #移到/opt/elasticsearch-6.2.4/plugins/试验不行,新版可能不让在该目录下安装插件
[root@bogon ~]# ls /opt/
elasticsearch-6.2.4 elasticsearch-head node-v9.6.1-linux-x64
[root@bogon ~]# cd /opt/elasticsearch-head/
[root@bogon elasticsearch-head]# ls
Dockerfile Gruntfile.js LICENCE proxy src
Dockerfile-alpine grunt_fileSets.js package.json README.textile test
elasticsearch-head.sublime-project index.html plugin-descriptor.properties _site
更换npm源,安装cnpm命令,使用cnpm命令安装head插件
[root@bogon elasticsearch-head]# npm install -g cnpm --registry=https://registry.npm.taobao.org
[root@bogon elasticsearch-head]# cnpm install #使用cnpm安装
……下面有些报错,但是没影响
Error: post install error, please remove node_modules before retry!
Run "sh -c node install.js" error, exit code 1
at ChildProcess.proc.on.code (/opt/node-v9.6.1-linux-x64/lib/node_modules/cnpm/node_modules/runscript/index.js:74:21)
at ChildProcess.emit (events.js:127:13)
……
[root@bogon elasticsearch-head]# vim Gruntfile.js
……
connect: {
server: {
options: {
hostname: '*', #添加
port: 9100,
base: '.',
keepalive: true
}
}
}
[root@bogon elasticsearch-head]# vim _site/app.js
……
this.base_uri = this.config.base_uri || this.prefs.get("app-base_uri") || "http://192.168.171.128:9200"; #修改成本机ip
配置es允许跨域访问:(修改es的配置文件)
[root@bogon elasticsearch-head]# vim /opt/elasticsearch-6.2.4/config/elasticsearch.yml
#最后面添加两个下面的
http.cors.enabled: true #添加
http.cors.allow-origin: '*' #添加
wq
d)重新启动es服务: (可以在另一个普通用户的窗口)
[esyonghu@bogon bin]$ ps -ef |grep elasticsearch
查看进程号:1311
[esyonghu@bogon bin]$ kill -9 1311
[esyonghu@bogon bin]$ pwd
/opt/elasticsearch-6.2.4/bin
[esyonghu@bogon bin]$ ./elasticsearch -d
[esyonghu@bogon bin]$ tailf /opt/elasticsearch-6.2.4/logs/elasticsearch.log
[esyonghu@bogon bin]$ netstat -anput |grep 9200
有端口
e)启动es-head插件:(另一个终端,可以用root用户启动)
[root@bogon elasticsearch-head]# cd /opt/elasticsearch-head/node_modules/grunt/bin/
[root@bogon bin]# ls
grunt
[root@bogon bin]# ./grunt server & #启动head插件服务
………
Running "connect:server" (connect) task
eWaiting forever...
Started connect web server on http://localhost:9100
[root@bogon bin]# netstat -anput |grep 9100
tcp6 0 0 :::9100 :::* LISTEN 2814/grunt
[root@bogon bin]# cd
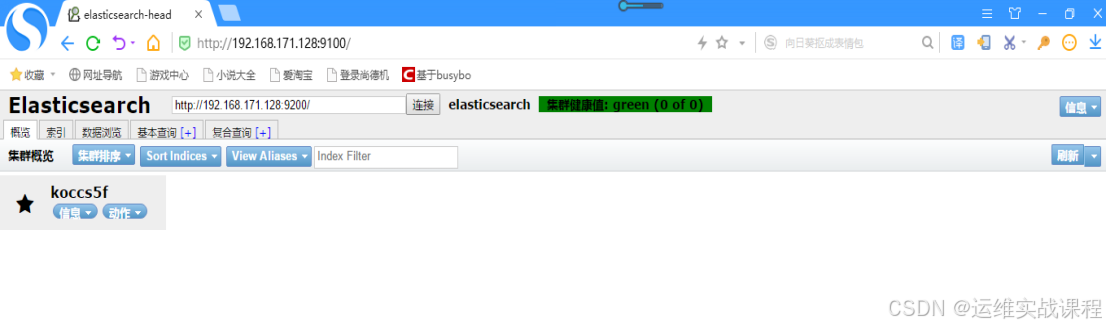
f)客户端浏览器访问:访问正常es和插件管理地址 http://192.168.171.128:9200/
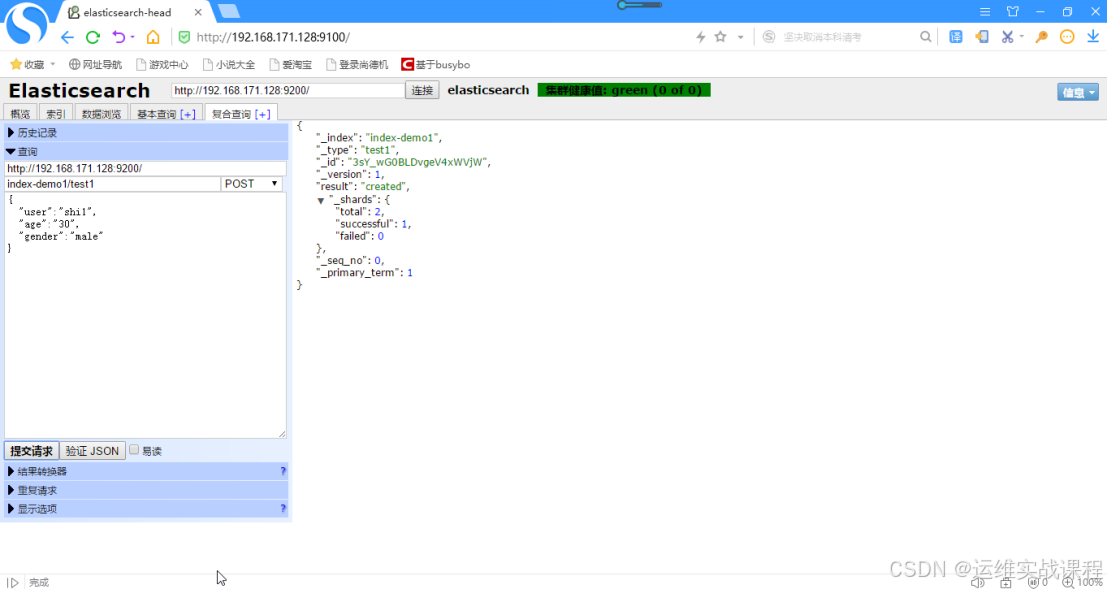
g)使用head插件管理工具,向elasticsearch服务里写些测试数据:
点击复合查询,如下:
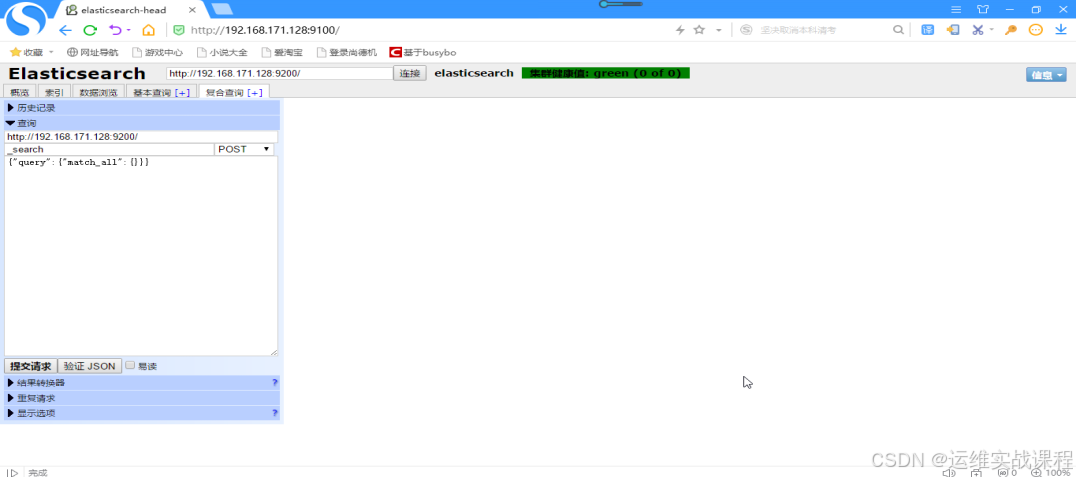
删除默认的,写些测试数据,如下:
http://192.168.171.128:9200/ #默认的地址,注意:最后一个/不能去掉
index-demo1/test1 #这些都是手动自定义的,创建后,形成的索引名(数据库名)就是:index-demo1,类型(表)是:test1,注:index-…前面不能有/,
数据:
{
"user":"shi1",
"age":"30",
"gender":"male"
}
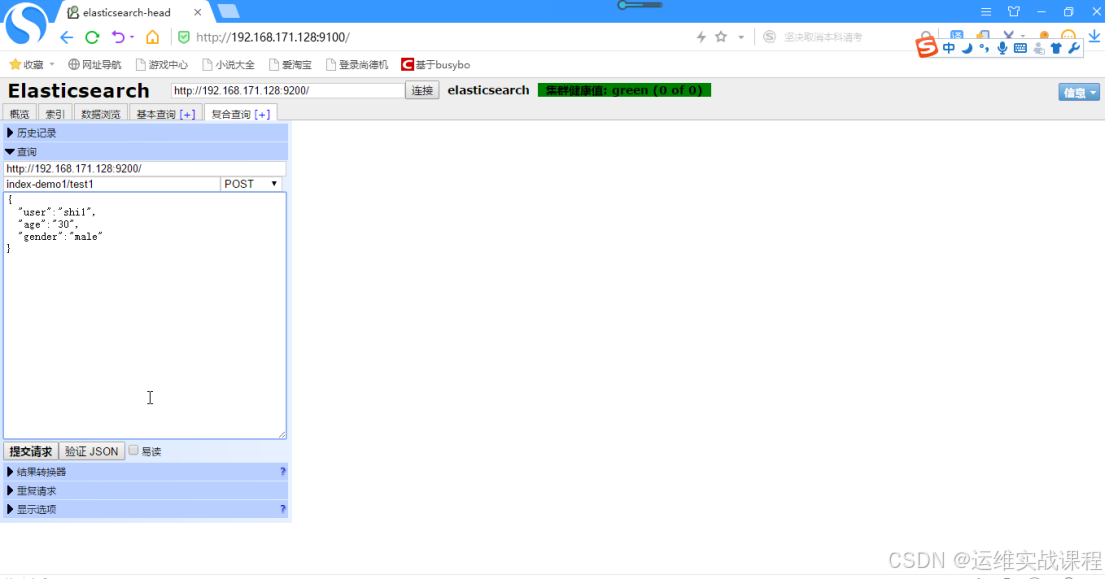
点击提交请求,如下
以此为例,再建立一些数据,点击数据浏览后,可查询数据,如下:
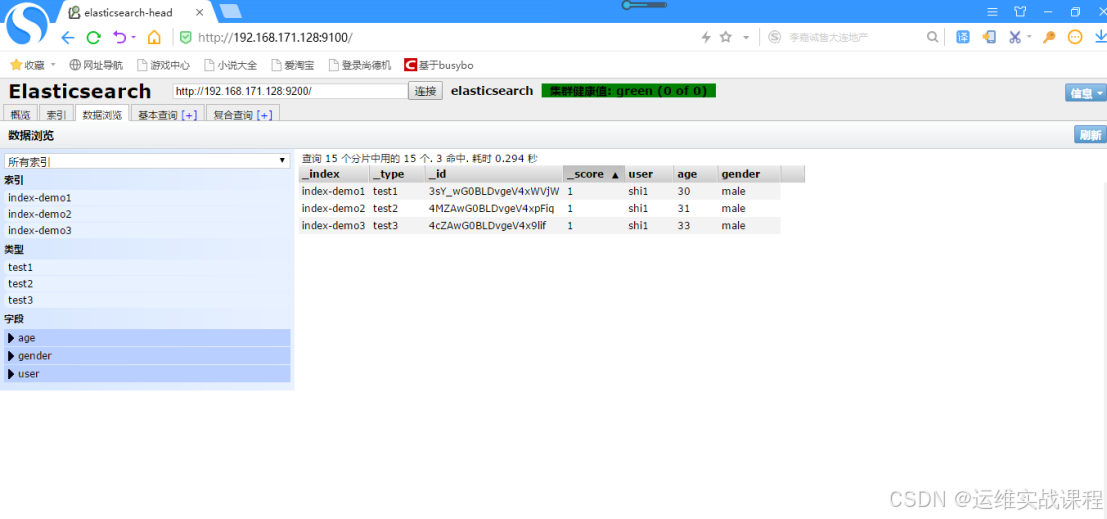
elasticsearch搭建完毕。
2)在192.168.171.129上:安装logstash6.2.4+准备准备的tomcat和系统日志文件:(版本要和es版本相同,是日志搜集服务,搜集日志后可写入es)
a)安装filebeat(需要jdk环境)
[root@bogon ~]# mkdir /usr/local/java
[root@bogon ~]# rz
上传jdk1.8包
[root@bogon ~]# ls
jdk-8u144-linux-x64.tar.gz
[root@bogon ~]# tar -zxf jdk-8u144-linux-x64.tar.gz
[root@bogon ~]# ls
jdk1.8.0_144 jdk-8u144-linux-x64.tar.gz
[root@bogon ~]# mv jdk1.8.0_144/ /usr/local/java/
[root@bogon ~]# ls /usr/local/java/
jdk1.8.0_144
[root@bogon ~]# vim /etc/profile
#最后面添加:
JAVA_HOME=/usr/local/java/jdk1.8.0_144
CLASSPATH=.:$JAVA_HOME/jre/lib/rt.jar:$JAVA_HOME/lib/dt.jar:$JAVA_HOME/lib/tools.jar
PATH=$JAVA_HOME/bin:$PATH
export JAVA_HOME CLASSPATH PATH
[root@bogon ~]# source /etc/profile
[root@bogon ~]# java -version
java version "1.8.0_144"
Java(TM) SE Runtime Environment (build 1.8.0_144-b01)
Java HotSpot(TM) 64-Bit Server VM (build 25.144-b01, mixed mode)
安装filebeat
[root@bogon ~]# rz
上传filebeat包
[root@bogon ~]# ls filebeat-6.2.2-x86_64.rpm
filebeat-6.2.2-x86_64.rpm
[root@bogon ~]# yum -y install filebeat-6.2.2-x86_64.rpm
[root@bogon ~]# cp /etc/filebeat/filebeat.yml /etc/filebeat/filebeat.yml.bak
[root@bogon ~]# vim /etc/filebeat/filebeat.yml #修改filebeat配置文件
###################### Filebeat Configuration Example #########################
# This file is an example configuration file highlighting only the most common
# options. The filebeat.reference.yml file from the same directory contains all the
# supported options with more comments. You can use it as a reference.
#
# You can find the full configuration reference here:
# https://www.elastic.co/guide/en/beats/filebeat/index.html
# For more available modules and options, please see the filebeat.reference.yml sample
# configuration file.
#=========================== Filebeat prospectors =============================
filebeat.prospectors:
# Each - is a prospector. Most options can be set at the prospector level, so
# you can use different prospectors for various configurations.
# Below are the prospector specific configurations.
# 系统日志:
- type: log
enabled: true
paths:
- /root/messages
fields:
log_source: system
# tomcat的catalina日志:
- type: log
enabled: true
paths:
- /root/catalina.out
fields:
log_source: catalina-log
multiline.pattern: '^[0-9]{4}-(((0[13578]|(10|12))-(0[1-9]|[1-2][0-9]|3[0-1]))|(02-(0[1-9]|[1-2][0-9]))|((0[469]|11)-(0[1-9]|[1-2][0-9]|30)))'
multiline.negate: true
multiline.match: after
# 上面正则是匹配日期开头正则,类似:2004-02-29开头的
# log_source: xxx 表示: 因为存入redis的只有一个索引名,logstash对多种类型日志无法区分,定义该项可以让logstash以此来判断日志来源,当是这种类型日志,输出相应的索引名存入es,当时另一种类型日志,输出相应索引名存入es
# es日志:
- type: log
enabled: true
paths:
- /root/es_log
fields:
log_source: es-log
multiline.pattern: '^\['
multiline.negate: true
multiline.match: after
#上面正则是是匹配以[开头的,\表示转义.
#tomcat的访问日志:
- type: log
enabled: true
paths:
- /root/localhost_access_log.2019-10-13.txt
fields:
log_source: tomcat-access-log
multiline.pattern: '^((2(5[0-5]|[0-4]\d))|[0-1]?\d{1,2})(\.((2(5[0-5]|[0-4]\d))|[0-1]?\d{1,2})){3}'
multiline.negate: true
multiline.match: after
output.redis:
hosts: ["192.168.171.131"]
port: 6379
password: "123"
key: "filebeat1"
db: 6
datatype: list
#注意:上面的filebeat1要和logstash中从redis里对应的key要要一致
#db: 6 随便从redis里选择了一个序号的数据库,也可0,1,等等
#multiline.pattern: '^((2(5[0-5]|[0-4]\d))|[0-1]?\d{1,2})(\.((2(5[0-5]|[0-4]\d))|[0-1]?\d{1,2})){3}'是匹配ip正则
# Exclude lines. A list of regular expressions to match. It drops the lines that are
# matching any regular expression from the list.
#exclude_lines: ['^DBG']
# Include lines. A list of regular expressions to match. It exports the lines that are
# matching any regular expression from the list.
#include_lines: ['^ERR', '^WARN']
# Exclude files. A list of regular expressions to match. Filebeat drops the files that
# are matching any regular expression from the list. By default, no files are dropped.
#exclude_files: ['.gz$']
# Optional additional fields. These fields can be freely picked
# to add additional information to the crawled log files for filtering
#fields:
# level: debug
# review: 1
### Multiline options
# Mutiline can be used for log messages spanning multiple lines. This is common
# for Java Stack Traces or C-Line Continuation
# The regexp Pattern that has to be matched. The example pattern matches all lines starting with [
#multiline.pattern: ^\[
# Defines if the pattern set under pattern should be negated or not. Default is false.
#multiline.negate: false
# Match can be set to "after" or "before". It is used to define if lines should be append to a pattern
# that was (not) matched before or after or as long as a pattern is not matched based on negate.
# Note: After is the equivalent to previous and before is the equivalent to to next in Logstash
#multiline.match: after
#============================= Filebeat modules ===============================
filebeat.config.modules:
# Glob pattern for configuration loading
path: ${path.config}/modules.d/*.yml
# Set to true to enable config reloading
reload.enabled: false
# Period on which files under path should be checked for changes
#reload.period: 10s
#==================== Elasticsearch template setting ==========================
setup.template.settings:
index.number_of_shards: 3
#index.codec: best_compression
#_source.enabled: false
#================================ General =====================================
# The name of the shipper that publishes the network data. It can be used to group
# all the transactions sent by a single shipper in the web interface.
#name:
# The tags of the shipper are included in their own field with each
# transaction published.
#tags: ["service-X", "web-tier"]
# Optional fields that you can specify to add additional information to the
# output.
#fields:
# env: staging
#============================== Dashboards =====================================
# These settings control loading the sample dashboards to the Kibana index. Loading
# the dashboards is disabled by default and can be enabled either by setting the
# options here, or by using the `-setup` CLI flag or the `setup` command.
#setup.dashboards.enabled: false
# The URL from where to download the dashboards archive. By default this URL
# has a value which is computed based on the Beat name and version. For released
# versions, this URL points to the dashboard archive on the artifacts.elastic.co
# website.
#setup.dashboards.url:
#============================== Kibana =====================================
# Starting with Beats version 6.0.0, the dashboards are loaded via the Kibana API.
# This requires a Kibana endpoint configuration.
setup.kibana:
# Kibana Host
# Scheme and port can be left out and will be set to the default (http and 5601)
# In case you specify and additional path, the scheme is required: http://localhost:5601/path
# IPv6 addresses should always be defined as: https://[2001:db8::1]:5601
#host: "localhost:5601"
#============================= Elastic Cloud ==================================
# These settings simplify using filebeat with the Elastic Cloud (https://cloud.elastic.co/).
# The cloud.id setting overwrites the `output.elasticsearch.hosts` and
# `setup.kibana.host` options.
# You can find the `cloud.id` in the Elastic Cloud web UI.
#cloud.id:
# The cloud.auth setting overwrites the `output.elasticsearch.username` and
# `output.elasticsearch.password` settings. The format is `<user>:<pass>`.
#cloud.auth:
#================================ Outputs =====================================
# Configure what output to use when sending the data collected by the beat.
#-------------------------- Elasticsearch output ------------------------------
#output.elasticsearch:
# Array of hosts to connect to.
# hosts: ["localhost:9200"]
# Optional protocol and basic auth credentials.
#protocol: "https"
#username: "elastic"
#password: "changeme"
#----------------------------- Logstash output --------------------------------
#output.logstash:
# The Logstash hosts
#hosts: ["localhost:5044"]
# Optional SSL. By default is off.
# List of root certificates for HTTPS server verifications
#ssl.certificate_authorities: ["/etc/pki/root/ca.pem"]
# Certificate for SSL client authentication
#ssl.certificate: "/etc/pki/client/cert.pem"
# Client Certificate Key
#ssl.key: "/etc/pki/client/cert.key"
#================================ Logging =====================================
# Sets log level. The default log level is info.
# Available log levels are: error, warning, info, debug
#logging.level: debug
# At debug level, you can selectively enable logging only for some components.
# To enable all selectors use ["*"]. Examples of other selectors are "beat",
# "publish", "service".
#logging.selectors: ["*"]
#============================== Xpack Monitoring ===============================
# filebeat can export internal metrics to a central Elasticsearch monitoring
# cluster. This requires xpack monitoring to be enabled in Elasticsearch. The
# reporting is disabled by default.
# Set to true to enable the monitoring reporter.
#xpack.monitoring.enabled: false
# Uncomment to send the metrics to Elasticsearch. Most settings from the
# Elasticsearch output are accepted here as well. Any setting that is not set is
# automatically inherited from the Elasticsearch output configuration, so if you
# have the Elasticsearch output configured, you can simply uncomment the
# following line.
#xpack.monitoring.elasticsearch:
[root@bogon ~]# systemctl restart filebeat #启动filebeat,收集不同类型日志写入到redis中
[root@bogon ~]# tailf /var/log/filebeat/filebeat
b)安装tomcat8
[root@localhost ~]# ls apache-tomcat-8.0.32.tar.gz
apache-tomcat-8.0.32.tar.gz
[root@localhost ~]# tar -zxf apache-tomcat-8.0.32.tar.gz
[root@localhost ~]# mv apache-tomcat-8.0.32 /usr/local/
[root@localhost ~]# ls /usr/local/apache-tomcat-8.0.32/
bin conf lib LICENSE logs NOTICE RELEASE-NOTES RUNNING.txt temp webapps work
[root@localhost ~]# /usr/local/apache-tomcat-8.0.32/bin/catalina.sh start
[root@localhost ~]# tail -15 /usr/local/apache-tomcat-8.0.32/logs/catalina.out
13-Oct-2019 12:56:10.193 INFO [main] org.apache.catalina.core.StandardService.startInternal Starting service Catalina
13-Oct-2019 12:56:10.194 INFO [main] org.apache.catalina.core.StandardEngine.startInternal Starting Servlet Engine: Apache Tomcat/8.0.32
13-Oct-2019 12:56:10.230 INFO [localhost-startStop-1] org.apache.catalina.startup.HostConfig.deployDirectory Deploying web application directory /usr/local/apache-tomcat-8.0.32/webapps/ROOT
13-Oct-2019 12:56:11.600 INFO [localhost-startStop-1] org.apache.catalina.startup.HostConfig.deployDirectory Deployment of web application directory /usr/local/apache-tomcat-8.0.32/webapps/ROOT has finished in 1,369 ms
13-Oct-2019 12:56:11.600 INFO [localhost-startStop-1] org.apache.catalina.startup.HostConfig.deployDirectory Deploying web application directory /usr/local/apache-tomcat-8.0.32/webapps/docs
13-Oct-2019 12:56:11.788 INFO [localhost-startStop-1] org.apache.catalina.startup.HostConfig.deployDirectory Deployment of web application directory /usr/local/apache-tomcat-8.0.32/webapps/docs has finished in 188 ms
13-Oct-2019 12:56:11.788 INFO [localhost-startStop-1] org.apache.catalina.startup.HostConfig.deployDirectory Deploying web application directory /usr/local/apache-tomcat-8.0.32/webapps/examples
13-Oct-2019 12:56:13.037 INFO [localhost-startStop-1] org.apache.catalina.startup.HostConfig.deployDirectory Deployment of web application directory /usr/local/apache-tomcat-8.0.32/webapps/examples has finished in 1,249 ms
13-Oct-2019 12:56:13.038 INFO [localhost-startStop-1] org.apache.catalina.startup.HostConfig.deployDirectory Deploying web application directory /usr/local/apache-tomcat-8.0.32/webapps/host-manager
13-Oct-2019 12:56:13.117 INFO [localhost-startStop-1] org.apache.catalina.startup.HostConfig.deployDirectory Deployment of web application directory /usr/local/apache-tomcat-8.0.32/webapps/host-manager has finished in 79 ms
13-Oct-2019 12:56:13.118 INFO [localhost-startStop-1] org.apache.catalina.startup.HostConfig.deployDirectory Deploying web application directory /usr/local/apache-tomcat-8.0.32/webapps/manager
13-Oct-2019 12:56:13.175 INFO [localhost-startStop-1] org.apache.catalina.startup.HostConfig.deployDirectory Deployment of web application directory /usr/local/apache-tomcat-8.0.32/webapps/manager has finished in 58 ms
13-Oct-2019 12:56:13.199 INFO [main] org.apache.coyote.AbstractProtocol.start Starting ProtocolHandler ["http-nio-8080"]
13-Oct-2019 12:56:13.247 INFO [main] org.apache.coyote.AbstractProtocol.start Starting ProtocolHandler ["ajp-nio-8009"]
13-Oct-2019 12:56:13.249 INFO [main] org.apache.catalina.startup.Catalina.start Server startup in 3106 ms
3)在192.168.171.130上: 安装kibana和nginx,nginx配置,使得kibana能用用户登录认证。
a)安装kibana6.2.4(不需要java环境),自身不支持认证登录,需要配合nginx
[root@bogon ~]# rz
上传kibana包
[root@bogon ~]# ls kibana-6.2.4-linux-x86_64.tar.gz
kibana-6.2.4-linux-x86_64.tar.gz
[root@bogon ~]# tar zxf kibana-6.2.4-linux-x86_64.tar.gz
[root@bogon ~]# ls
01-logstash.conf jdk-8u144-linux-x64.tar.gz kibana-6.2.4-linux-x86_64.tar.gz node-v9.6.1-linux-x64.tar test_multiline.conf
elasticsearch-6.2.4.tar.gz kibana-6.2.4-linux-x86_64 logstash-6.2.4.tar.gz sys-java-log.conf
[root@bogon ~]# mv kibana-6.2.4-linux-x86_64 /opt/
[root@bogon ~]# ls /opt/
elasticsearch-6.2.4 elasticsearch-head kibana-6.2.4-linux-x86_64 logstash-6.2.4 node-v9.6.1-linux-x64
[root@bogon ~]# cd /opt/kibana-6.2.4-linux-x86_64/
[root@bogon kibana-6.2.4-linux-x86_64]# ls
bin config data LICENSE.txt node node_modules NOTICE.txt optimize package.json plugins README.txt src ui_framework webpackShims
[root@bogon kibana-6.2.4-linux-x86_64]# vim config/kibana.yml
server.port: 5601 #本身的服务端口5601默认
server.host: "0.0.0.0" #监听本机所有ip
elasticsearch.url: "http://192.168.171.128:9200" #连接es,从es获取数据
kibana.index: ".kibana" #kibana的索引,
wq
[root@bogon kibana-6.2.4-linux-x86_64]# cd bin/
[root@bogon bin]# ls
kibana kibana-keystore kibana-plugin
[root@bogon bin]# ./kibana & #后台运行kibana
[2] 13186
[root@bogon bin]# log [07:18:24.849] [info][status][plugin:kibana@6.2.4] Status changed from uninitialized to green - Ready
log [07:18:24.904] [info][status][plugin:elasticsearch@6.2.4] Status changed from uninitialized to yellow - Waiting for Elasticsearch
log [07:18:25.062] [info][status][plugin:timelion@6.2.4] Status changed from uninitialized to green - Ready
log [07:18:25.071] [info][status][plugin:console@6.2.4] Status changed from uninitialized to green - Ready
log [07:18:25.079] [info][status][plugin:metrics@6.2.4] Status changed from uninitialized to green - Ready
log [07:18:25.106] [info][listening] Server running at http://0.0.0.0:5601
log [07:18:25.152] [info][status][plugin:elasticsearch@6.2.4] Status changed from yellow to green - Ready
[root@bogon bin]# netstat -anput |grep 5601
tcp 0 0 0.0.0.0:5601 0.0.0.0:* LISTEN 13186/./../node/bin
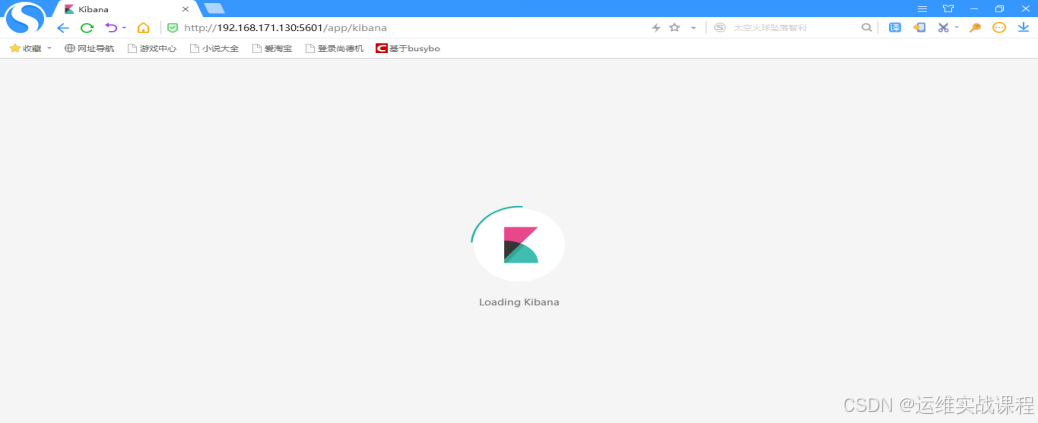
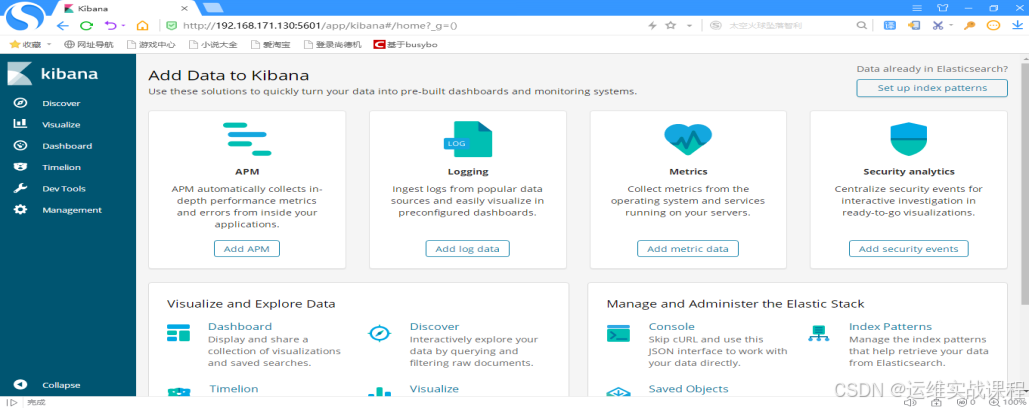
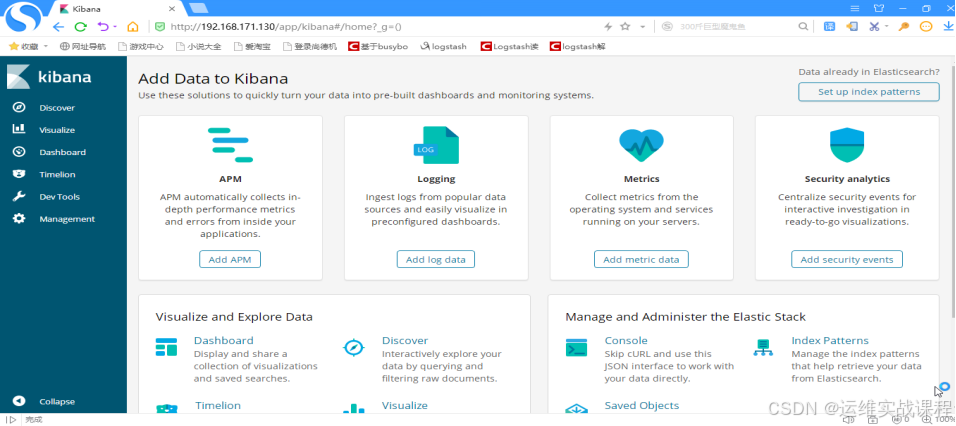
浏览器直接访问kibana界面:http://192.168.171.130:5601 回车后直接就能登录进来,如下:
b)安装nginx,并配置结合kibana,能让kibana通过使用用户和密码认证登录。
[root@bogon ~]# yum -y install gcc gcc-c++
[root@bogon ~]# yum -y install openssl-devel openssl zlib zlib-devel pcre pcre-devel
[root@bogon ~]# rz
上传nginx包
[root@bogon ~]# ls nginx-1.6.2.tar.gz
nginx-1.6.2.tar.gz
[root@bogon ~]# tar -zxf nginx-1.6.2.tar.gz
[root@bogon ~]# cd nginx-1.6.2
[root@bogon nginx-1.6.2]# ls
auto CHANGES CHANGES.ru conf configure contrib html LICENSE man README src
[root@bogon nginx-1.6.2]# useradd -s /sbin/nologin -M nginx
[root@bogon nginx-1.6.2]# ./configure --user=nginx --group=nginx --prefix=/usr/local/nginx --with-http_stub_status_module --with-http_ssl_module
[root@bogon nginx-1.6.2]# make && make install
[root@bogon nginx-1.6.2]# ls /usr/local/nginx/
conf html logs sbin
[root@bogon nginx-1.6.2]# /usr/local/nginx/sbin/nginx -t
nginx: the configuration file /usr/local/nginx/conf/nginx.conf syntax is ok
nginx: configuration file /usr/local/nginx/conf/nginx.conf test is successful
[root@bogon nginx-1.6.2]# /usr/local/nginx/sbin/nginx
[root@bogon nginx-1.6.2]# netstat -anput |grep 80
tcp 0 0 0.0.0.0:80 0.0.0.0:* LISTEN 15918/nginx: master
[root@localhost nginx-1.6.2]# cd
[root@localhost ~]# vim /usr/local/nginx/conf/nginx.conf
.......
server {
listen 80;
server_name localhost;
location / {
root html;
index index.html index.htm;
auth_basic "Please input user and password"; #添加
auth_basic_user_file /usr/local/nginx/conf/passwd.db; #添加
proxy_pass http://192.168.171.130:5601; #添加
}
}
.........
[root@localhost ~]# openssl passwd -crypt 123456 #将明文密码进行加密,然后将加密内容写入密码文件
3KWv9TAdX4Qx2
[root@localhost ~]# vim /usr/local/nginx/conf/passwd.db
shi:3KWv9TAdX4Qx2
[root@localhost ~]# /usr/local/nginx/sbin/nginx -s reload
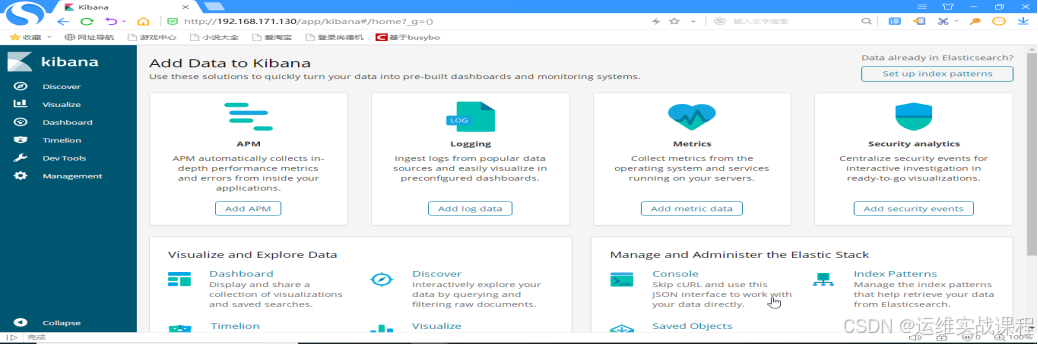
浏览器通过访问nginx访问kibana界面:http://192.168.171.130 回车后,需要输入用户名和密码: shi/123456
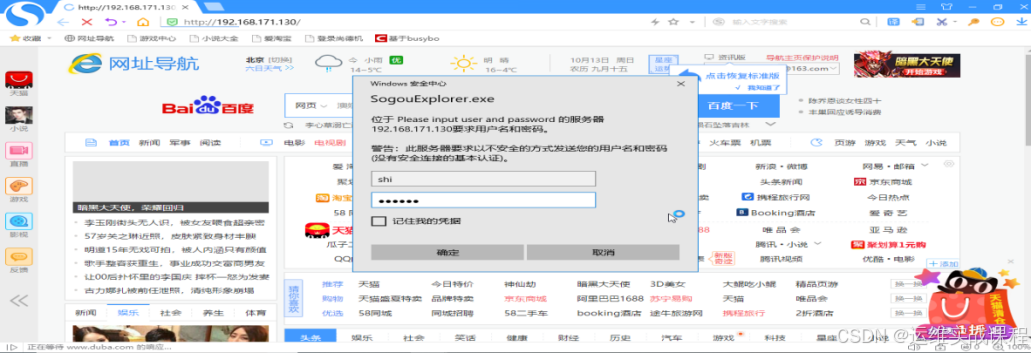
确定后,才能登录,如下:
4)redis机器:在192.168.171.131上安装redis(redis密码:123)和logstash2服务
a)安装redis
[root@bogon ~]# yum -y install epel-release
[root@bogon ~]# yum -y install redis
[root@bogon ~]# vim /etc/redis.conf
daemonize yes
bind 0.0.0.0 #默认绑定127.0.0.1,客户端没权限连接,修改成0.0.0.0后,客户端和本地都能连接redis
port 6379
requirepass 123
[root@bogon ~]# systemctl start redis
[root@bogon ~]# systemctl enable redis
[root@bogon ~]# netstat -anput |grep 6379
tcp 0 0 127.0.0.1:6379 0.0.0.0:* LISTEN 1643/redis-server 1
[root@bogon ~]# redis-cli -a 123
127.0.0.1:6379> set k1 v1
OK
127.0.0.1:6379> get k1
"v1"
127.0.0.1:6379> quit
b)安装logstash2 6.2.4(需要jdk环境)
[root@bogon ~]# mkdir /usr/local/java
[root@bogon ~]# rz
上传jdk1.8包
[root@bogon ~]# ls
jdk-8u144-linux-x64.tar.gz
[root@bogon ~]# tar -zxf jdk-8u144-linux-x64.tar.gz
[root@bogon ~]# ls
jdk1.8.0_144 jdk-8u144-linux-x64.tar.gz
[root@bogon ~]# mv jdk1.8.0_144/ /usr/local/java/
[root@bogon ~]# ls /usr/local/java/
jdk1.8.0_144
[root@bogon ~]# vim /etc/profile
#最后面添加:
JAVA_HOME=/usr/local/java/jdk1.8.0_144
CLASSPATH=.:$JAVA_HOME/jre/lib/rt.jar:$JAVA_HOME/lib/dt.jar:$JAVA_HOME/lib/tools.jar
PATH=$JAVA_HOME/bin:$PATH
export JAVA_HOME CLASSPATH PATH
[root@bogon ~]# source /etc/profile
[root@bogon ~]# java -version
java version "1.8.0_144"
Java(TM) SE Runtime Environment (build 1.8.0_144-b01)
Java HotSpot(TM) 64-Bit Server VM (build 25.144-b01, mixed mode)
[root@bogon ~]# rz
上传logstash包
[root@bogon ~]# ls
jdk-8u144-linux-x64.tar.gz logstash-6.2.4.tar.gz
[root@bogon ~]# tar -zxf logstash-6.2.4.tar.gz
[root@bogon ~]# mv logstash-6.2.4 /opt/
[root@bogon ~]# ls /opt/
elasticsearch-6.2.4 elasticsearch-head logstash-6.2.4 node-v9.6.1-linux-x64
[root@bogon ~]# ls /opt/logstash-6.2.4/
bin CONTRIBUTORS Gemfile lib logstash-core modules tools
config data Gemfile.lock LICENSE logstash-core-plugin-api NOTICE.TXT vendor
[root@bogon ~]# ls /opt/logstash-6.2.4/bin/logstash
/opt/logstash-6.2.4/bin/logstash
[root@bogon ~]# cd /opt/logstash-6.2.4/
[root@bogon logstash-6.2.4]# ls
bin CONTRIBUTORS Gemfile lib logstash-core modules tools
config data Gemfile.lock LICENSE logstash-core-plugin-api NOTICE.TXT vendor
[root@bogon logstash-6.2.4]# cd
[root@bogon ~]# export PATH=$PATH:/opt/logstash-6.2.4/bin
[root@bogon ~]# echo "PATH=$PATH:/opt/logstash-6.2.4/bin" >> /etc/profile
[root@bogon ~]# source /etc/profile
[root@bogon ~]# logstash -V
logstash 6.2.4
logstash安装完毕,启动时候,可以先创建配置文件,然后指定配置文件启动,配置文件位置在哪都行,启动时候能找到就行,内容也是自己定义写的内容。
5)在192.168.171.129上启动filebeat服务,将本地的系统日志和tomcat日志文件收集并写入elk中——多行匹配(各种类型,不同情况使用不同正则,根据实际情况使用正则)
a)通过tomcat服务制造点日志,如下:(以日期开头的为一条,一共5条,如下)(以其中一种类型的日志类型,匹配正则为例,其他根据情况)
一定注意:下面日志不能提前生成,需要先启动filebeat开始收集后,在vim编写下面的日志,否则filebeat不能读取已经有的日志.
[root@localhost ~]# cat /root/catalina.out tomcat日志
2019-10-13 13:07:48|ERROR|org.springframework.web.context.ContextLoader:351|Context initialization failed
org.springframework.beans.factory.parsing.BeanDefinitionParsingException: Configuration problem: Unable to locate Spring NamespaceHandler for XML schema namespace [http://www.springframework.org/schema/aop]
Offending resource: URL [file:/usr/local/apache-tomcat-8.0.32/webapps/ROOT/WEB-INF/classes/applicationContext.xml]
at org.springframework.beans.factory.parsing.FailFastProblemReporter.error(FailFastProblemReporter.java:70) ~[spring-beans-4.2.6.RELEASE.jar:4.2.6.RELEASE]
at org.springframework.beans.factory.parsing.ReaderContext.error(ReaderContext.java:85) ~[spring-beans-4.2.6.RELEASE.jar:4.2.6.RELEASE]
at org.springframework.beans.factory.parsing.ReaderContext.error(ReaderContext.java:80) ~[spring-beans-4.2.6.RELEASE.jar:4.2.6.RELEASE]
at org.springframework.beans.factory.xml.BeanDefinitionParserDelegate.error(BeanDefinitionParserDelegate.java:301) ~[spring-beans-4.2.6.RELEASE.jar:4.2.6.RELEASE]
at org.springframework.beans.factory.xml.BeanDefinitionParserDelegate.parseCustomElement(BeanDefinitionParserDelegate.java:1408) ~[spring-beans-4.2.6.RELEASE.jar:4.2.6.RELEASE]
at org.springframework.beans.factory.xml.BeanDefinitionParserDelegate.parseCustomElement(BeanDefinitionParserDelegate.java:1401) ~[spring-beans-4.2.6.RELEASE.jar:4.2.6.RELEASE]
at org.springframework.beans.factory.xml.DefaultBeanDefinitionDocumentReader.parseBeanDefinitions(DefaultBeanDefinitionDocumentReader.java:168) ~[spring-beans-4.2.6.RELEASE.jar:4.2.6.RELEASE]
at org.springframework.beans.factory.xml.DefaultBeanDefinitionDocumentReader.doRegisterBeanDefinitions(DefaultBeanDefinitionDocumentReader.java:138) ~[spring-beans-4.2.6.RELEASE.jar:4.2.6.RELEASE]
at org.springframework.beans.factory.xml.DefaultBeanDefinitionDocumentReader.registerBeanDefinitions(DefaultBeanDefinitionDocumentReader.java:94) ~[spring-beans-4.2.6.RELEASE.jar:4.2.6.RELEASE]
at org.springframework.beans.factory.xml.XmlBeanDefinitionReader.registerBeanDefinitions(XmlBeanDefinitionReader.java:508) ~[spring-beans-4.2.6.RELEASE.jar:4.2.6.RELEASE]
at org.springframework.beans.factory.xml.XmlBeanDefinitionReader.doLoadBeanDefinitions(XmlBeanDefinitionReader.java:392) ~[spring-beans-4.2.6.RELEASE.jar:4.2.6.RELEASE]
at org.springframework.beans.factory.xml.XmlBeanDefinitionReader.loadBeanDefinitions(XmlBeanDefinitionReader.java:336) ~[spring-beans-4.2.6.RELEASE.jar:4.2.6.RELEASE]
at org.springframework.beans.factory.xml.XmlBeanDefinitionReader.loadBeanDefinitions(XmlBeanDefinitionReader.java:304) ~[spring-beans-4.2.6.RELEASE.jar:4.2.6.RELEASE]
at org.springframework.beans.factory.support.AbstractBeanDefinitionReader.loadBeanDefinitions(AbstractBeanDefinitionReader.java:181) ~[spring-beans-4.2.6.RELEASE.jar:4.2.6.RELEASE]
at org.springframework.beans.factory.support.AbstractBeanDefinitionReader.loadBeanDefinitions(AbstractBeanDefinitionReader.java:217) ~[spring-beans-4.2.6.RELEASE.jar:4.2.6.RELEASE]
at org.springframework.beans.factory.support.AbstractBeanDefinitionReader.loadBeanDefinitions(AbstractBeanDefinitionReader.java:188) ~[spring-beans-4.2.6.RELEASE.jar:4.2.6.RELEASE]
at org.springframework.web.context.support.XmlWebApplicationContext.loadBeanDefinitions(XmlWebApplicationContext.java:125) ~[spring-web-4.2.6.RELEASE.jar:4.2.6.RELEASE]
at org.springframework.web.context.support.XmlWebApplicationContext.loadBeanDefinitions(XmlWebApplicationContext.java:94) ~[spring-web-4.2.6.RELEASE.jar:4.2.6.RELEASE]
at org.springframework.context.support.AbstractRefreshableApplicationContext.refreshBeanFactory(AbstractRefreshableApplicationContext.java:129) ~[spring-context-4.2.6.RELEASE.jar:4.2.6.RELEASE]
at org.springframework.context.support.AbstractApplicationContext.obtainFreshBeanFactory(AbstractApplicationContext.java:609) ~[spring-context-4.2.6.RELEASE.jar:4.2.6.RELEASE]
at org.springframework.context.support.AbstractApplicationContext.refresh(AbstractApplicationContext.java:510) ~[spring-context-4.2.6.RELEASE.jar:4.2.6.RELEASE]
at org.springframework.web.context.ContextLoader.configureAndRefreshWebApplicationContext(ContextLoader.java:444) ~[spring-web-4.2.6.RELEASE.jar:4.2.6.RELEASE]
at org.springframework.web.context.ContextLoader.initWebApplicationContext(ContextLoader.java:326) ~[spring-web-4.2.6.RELEASE.jar:4.2.6.RELEASE]
at org.springframework.web.context.ContextLoaderListener.contextInitialized(ContextLoaderListener.java:107) [spring-web-4.2.6.RELEASE.jar:4.2.6.RELEASE]
at org.apache.catalina.core.StandardContext.listenerStart(StandardContext.java:4812) [catalina.jar:8.0.32]
at org.apache.catalina.core.StandardContext.startInternal(StandardContext.java:5255) [catalina.jar:8.0.32]
at org.apache.catalina.util.LifecycleBase.start(LifecycleBase.java:147) [catalina.jar:8.0.32]
at org.apache.catalina.core.ContainerBase.addChildInternal(ContainerBase.java:725) [catalina.jar:8.0.32]
at org.apache.catalina.core.ContainerBase.addChild(ContainerBase.java:701) [catalina.jar:8.0.32]
at org.apache.catalina.core.StandardHost.addChild(StandardHost.java:717) [catalina.jar:8.0.32]
at org.apache.catalina.startup.HostConfig.deployDirectory(HostConfig.java:1091) [catalina.jar:8.0.32]
at org.apache.catalina.startup.HostConfig$DeployDirectory.run(HostConfig.java:1830) [catalina.jar:8.0.32]
at java.util.concurrent.Executors$RunnableAdapter.call(Executors.java:511) [na:1.8.0_144]
at java.util.concurrent.FutureTask.run(FutureTask.java:266) [na:1.8.0_144]
at java.util.concurrent.ThreadPoolExecutor.runWorker(ThreadPoolExecutor.java:1149) [na:1.8.0_144]
at java.util.concurrent.ThreadPoolExecutor$Worker.run(ThreadPoolExecutor.java:624) [na:1.8.0_144]
at java.lang.Thread.run(Thread.java:748) [na:1.8.0_144]
13-Oct-2019 13:07:48.990 SEVERE [localhost-startStop-3] org.apache.catalina.core.StandardContext.startInternal One or more listeners failed to start. Full details will be found in the appropriate container log file
13-Oct-2019 13:07:48.991 SEVERE [localhost-startStop-3] org.apache.catalina.core.StandardContext.startInternal Context [] startup failed due to previous errors
2019-10-13 13:07:48|INFO|org.springframework.context.support.AbstractApplicationContext:960|Closing Root WebApplicationContext: startup date [Sun Oct 13 13:07:43 CST 2019]; root of context hierarchy
2019-10-13 13:09:41|INFO|org.springframework.context.support.AbstractApplicationContext:960|Closing Root WebApplicationContext: startup date [Sun Oct 13 13:07:43 CST 2019]; root of context hierarchy error test1
2019-10-13 13:10:41|INFO|org.springframework.context.support.AbstractApplicationContext:960|Closing Root WebApplicationContext: startup date [Sun Oct 13 13:07:43 CST 2019]; root of context hierarchy error test2
2019-10-13 13:11:41|INFO|org.springframework.context.support.AbstractApplicationContext:960|Closing Root WebApplicationContext: startup date [Sun Oct 13 13:07:43 CST 2019]; root of context hierarchy error test3
[root@localhost ~]# cat /root/messages (将/var/log/messages部分弄出来) 系统日志
Oct 13 14:19:06 localhost systemd: Removed slice system-selinux\x2dpolicy\x2dmigrate\x2dlocal\x2dchanges.slice.
Oct 13 14:19:06 localhost systemd: Stopping system-selinux\x2dpolicy\x2dmigrate\x2dlocal\x2dchanges.slice.
Oct 13 14:19:06 localhost systemd: Stopped target Network is Online.
Oct 13 14:19:06 localhost systemd: Stopping Network is Online.
Oct 13 14:19:06 localhost systemd: Stopping Authorization Manager...
Oct 13 14:20:38 localhost kernel: Initializing cgroup subsys cpuset
Oct 13 14:20:38 localhost kernel: Initializing cgroup subsys cpu
Oct 13 14:20:38 localhost kernel: Initializing cgroup subsys cpuacct
Oct 13 14:20:38 localhost kernel: Linux version 3.10.0-693.el7.x86_64 (builder@kbuilder.dev.centos.org) (gcc version 4.8.5 20150623 (Red Hat 4.8.5-16) (GCC) ) #1 SMP Tue Aug 22 21:09:27 UTC 2017
Oct 13 14:20:38 localhost kernel: Command line: BOOT_IMAGE=/vmlinuz-3.10.0-693.el7.x86_64 root=/dev/mapper/centos-root ro crashkernel=auto rd.lvm.lv=centos/root rd.lvm.lv=centos/swap rhgb quiet LANG=en_US.UTF-8
[root@localhost ~]# cat es_log es的日志
[2019-10-12T21:44:58,440][ERROR][o.e.b.Bootstrap ] Exception
java.lang.RuntimeException: can not run elasticsearch as root
at org.elasticsearch.bootstrap.Bootstrap.initializeNatives(Bootstrap.java:105) ~[elasticsearch-6.2.4.jar:6.2.4]
at org.elasticsearch.bootstrap.Bootstrap.setup(Bootstrap.java:172) ~[elasticsearch-6.2.4.jar:6.2.4]
at org.elasticsearch.bootstrap.Bootstrap.init(Bootstrap.java:323) [elasticsearch-6.2.4.jar:6.2.4]
at org.elasticsearch.bootstrap.Elasticsearch.init(Elasticsearch.java:121) [elasticsearch-6.2.4.jar:6.2.4]
at org.elasticsearch.bootstrap.Elasticsearch.execute(Elasticsearch.java:112) [elasticsearch-6.2.4.jar:6.2.4]
at org.elasticsearch.cli.EnvironmentAwareCommand.execute(EnvironmentAwareCommand.java:86) [elasticsearch-6.2.4.jar:6.2.4]
at org.elasticsearch.cli.Command.mainWithoutErrorHandling(Command.java:124) [elasticsearch-cli-6.2.4.jar:6.2.4]
at org.elasticsearch.cli.Command.main(Command.java:90) [elasticsearch-cli-6.2.4.jar:6.2.4]
at org.elasticsearch.bootstrap.Elasticsearch.main(Elasticsearch.java:92) [elasticsearch-6.2.4.jar:6.2.4]
at org.elasticsearch.bootstrap.Elasticsearch.main(Elasticsearch.java:85) [elasticsearch-6.2.4.jar:6.2.4]
[2019-10-12T21:44:58,549][WARN ][o.e.b.ElasticsearchUncaughtExceptionHandler] [] uncaught exception in thread [main]
org.elasticsearch.bootstrap.StartupException: java.lang.RuntimeException: can not run elasticsearch as root
at org.elasticsearch.bootstrap.Elasticsearch.init(Elasticsearch.java:125) ~[elasticsearch-6.2.4.jar:6.2.4]
at org.elasticsearch.bootstrap.Elasticsearch.execute(Elasticsearch.java:112) ~[elasticsearch-6.2.4.jar:6.2.4]
at org.elasticsearch.cli.EnvironmentAwareCommand.execute(EnvironmentAwareCommand.java:86) ~[elasticsearch-6.2.4.jar:6.2.4]
at org.elasticsearch.cli.Command.mainWithoutErrorHandling(Command.java:124) ~[elasticsearch-cli-6.2.4.jar:6.2.4]
at org.elasticsearch.cli.Command.main(Command.java:90) ~[elasticsearch-cli-6.2.4.jar:6.2.4]
at org.elasticsearch.bootstrap.Elasticsearch.main(Elasticsearch.java:92) ~[elasticsearch-6.2.4.jar:6.2.4]
at org.elasticsearch.bootstrap.Elasticsearch.main(Elasticsearch.java:85) ~[elasticsearch-6.2.4.jar:6.2.4]
Caused by: java.lang.RuntimeException: can not run elasticsearch as root
at org.elasticsearch.bootstrap.Bootstrap.initializeNatives(Bootstrap.java:105) ~[elasticsearch-6.2.4.jar:6.2.4]
at org.elasticsearch.bootstrap.Bootstrap.setup(Bootstrap.java:172) ~[elasticsearch-6.2.4.jar:6.2.4]
at org.elasticsearch.bootstrap.Bootstrap.init(Bootstrap.java:323) ~[elasticsearch-6.2.4.jar:6.2.4]
at org.elasticsearch.bootstrap.Elasticsearch.init(Elasticsearch.java:121) ~[elasticsearch-6.2.4.jar:6.2.4]
... 6 more
[2019-10-12T21:46:32,174][INFO ][o.e.n.Node ] [] initializing ...
[2019-10-12T21:46:32,467][INFO ][o.e.e.NodeEnvironment ] [koccs5f] using [1] data paths, mounts [[/ (rootfs)]], net usable_space [48gb], net total_space [49.9gb], types [rootfs]
[2019-10-12T21:46:32,468][INFO ][o.e.e.NodeEnvironment ] [koccs5f] heap size [1015.6mb], compressed ordinary object pointers [true]
[root@bogon ~]# cat /root/localhost_access_log.2019-10-13.txt #tomcat的访问日志
192.168.171.1 - - [13/Oct/2019:13:07:59 +0800] "GET /favicon.ico HTTP/1.1" 404 -
Caused by: java.lang.RuntimeException: can not run elasticsearch as root
at org.elasticsearch.bootstrap.Bootstrap.initializeNatives(Bootstrap.java:105) ~[elasticsearch-6.2.4.jar:6.2.4]
at org.elasticsearch.bootstrap.Bootstrap.setup(Bootstrap.java:172) ~[elasticsearch-6.2.4.jar:6.2.4]
192.168.171.2 - - [13/Oct/2019:13:07:59 +0800] "GET / HTTP/1.1" 404 -
192.168.171.1 - - [13/Oct/2019:15:13:12 +0800] "GET / HTTP/1.1" 200 11250
Caused by: java.lang.RuntimeException: can not run elasticsearch as root
at org.elasticsearch.bootstrap.Bootstrap.initializeNatives
192.168.171.2 - - [13/Oct/2019:15:13:12 +0800] "GET /tomcat.png HTTP/1.1" 200 5103
192.168.171.3 - - [13/Oct/2019:15:13:12 +0800] "GET /tomcat.css HTTP/1.1" 200 5576
192.168.171.5 - - [13/Oct/2019:15:13:13 +0800] "GET /bg-nav.png HTTP/1.1" 200 1401
192.168.171.1 - - [13/Oct/2019:15:13:13 +0800] "GET /bg-upper.png HTTP/1.1" 200 3103
b)filebeat服务将本地系统日志和tomcat日志收集,并写入redis:
[root@bogon ~]# systemctl restart filebeat #重启filebeat服务,开始收集日志
然后vim,将日志写入各自文件,filebeat会自动搜集后,存入redis,上面安装时候已配置好。
启动后,在vim编辑产生日志,然后才能到redis中。
写入到redis后,到redis机器查看(192.168.171.131上):
[root@bogon ~]# redis-cli -h 192.168.171.131 -a 123
192.168.171.131:6379> select 6
OK
127.0.0.1:6379[6]> KEYS *
1) "filebeat1" #只以一个key键,filebeat1存储(名字是filebeat配置文件中定义好的的),存入es时候,可以根据不同类型分类出来.
127.0.0.1:6379[6]> LLEN filebeat1
(integer) 21
127.0.0.1:6379[6]> quit
c)在192.168.171.131上编写logstash配置文件,启动时候,从redis机器读出来各种类型日志,并写入es机器:
[root@bogon ~]# cd conf/
[root@bogon conf]# vim filebeat_redis_out_es_in.conf
input {
redis {
host => "192.168.171.131"
port => "6379"
password => "123"
db => "6"
data_type => "list"
key => "filebeat1"
}
}
#默认target是@timestamp,所以time_local会更新@timestamp时间。下面filter的date插件作用: 当第一次收集或使用缓存写入时候,会发现入库时间比日志实际时间有延时,导致时间不准确,最好加入date插件,使得>入库时间和日志实际时间保持一致.
filter {
date {
locale => "en"
match => ["time_local", "dd/MMM/yyyy:HH:mm:ss Z"]
}
}
output {
if [fields][log_source] == 'system' {
elasticsearch {
hosts => ["192.168.171.128:9200"]
index => "system-log-%{+YYYY.MM.dd}"
}
}
if [fields][log_source] == 'catalina-log' {
elasticsearch {
hosts => ["192.168.171.128:9200"]
index => "catalina-log-%{+YYYY.MM.dd}"
}
}
if [fields][log_source] == 'es-log' {
elasticsearch {
hosts => ["192.168.171.128:9200"]
index => "es-log-%{+YYYY.MM.dd}"
}
}
if [fields][log_source] == 'tomcat-access-log' {
elasticsearch {
hosts => ["192.168.171.128:9200"]
index => "tomcat-access-log-%{+YYYY.MM.dd}"
}
}
stdout { codec=> rubydebug }
# codec=> rubydebug 调试使用,能将信息输出到控制台
}
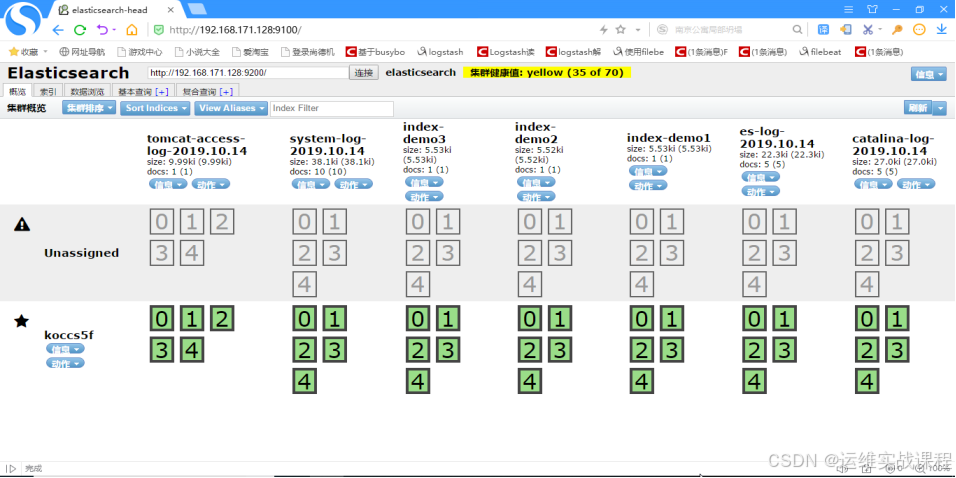
[root@bogon conf]# logstash -f filebeat_redis_out_es_in.conf #启动logstash服务,将redis数据写入es
到es机器查看,有写入的数据,并创建了索引:
6)在192.168.171.130上访问nginx代理的kibana,并配置kibana界面展示日志(从es中获取数据并展示)
a)登录kibana,输入用户名和密码: shi/123456
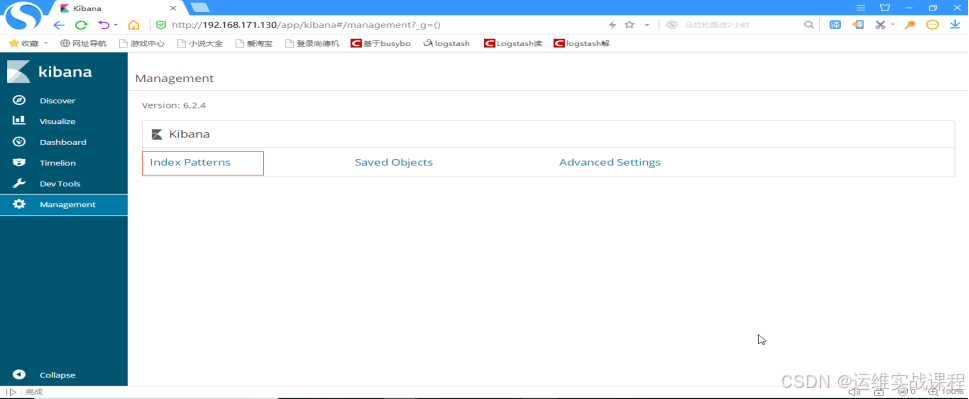
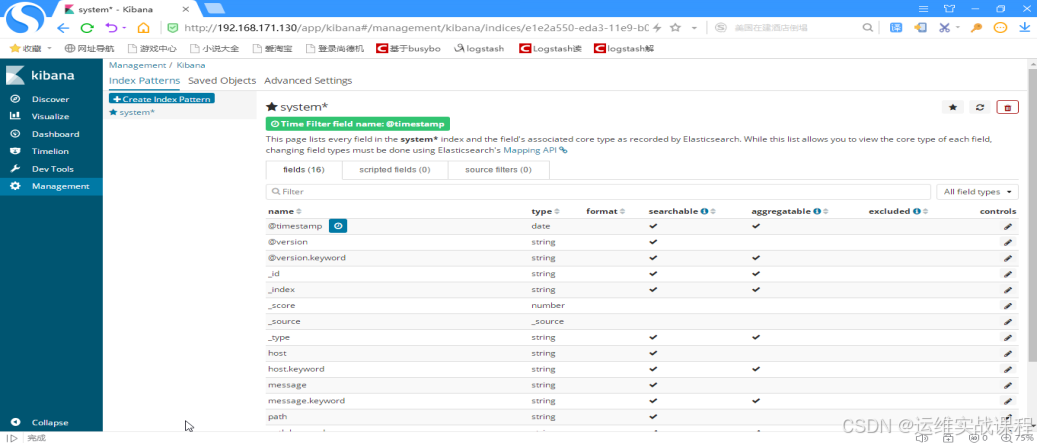
b)kibana依次创建索引(尽量和es里索引名对应,方便查找)——查询和展示es里的数据
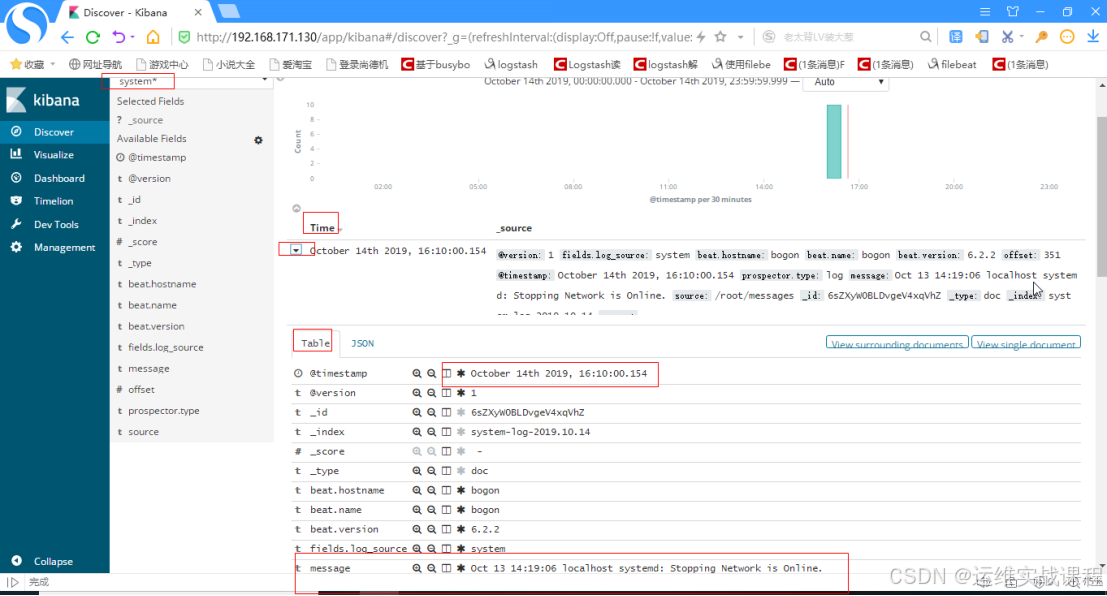
先创建system-*索引:
点击management,如下:
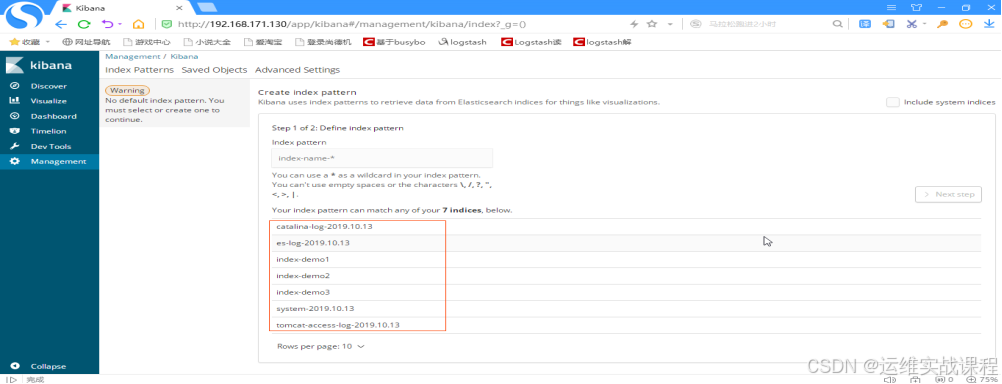
输入system*,如下:
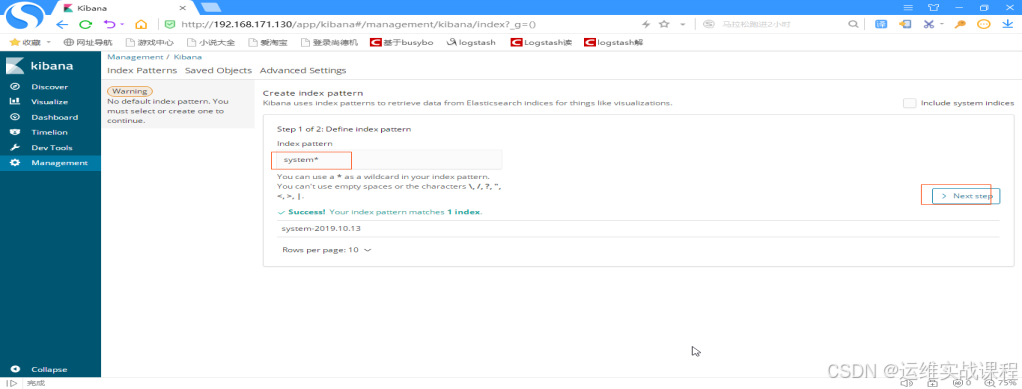
点击next step,如下:
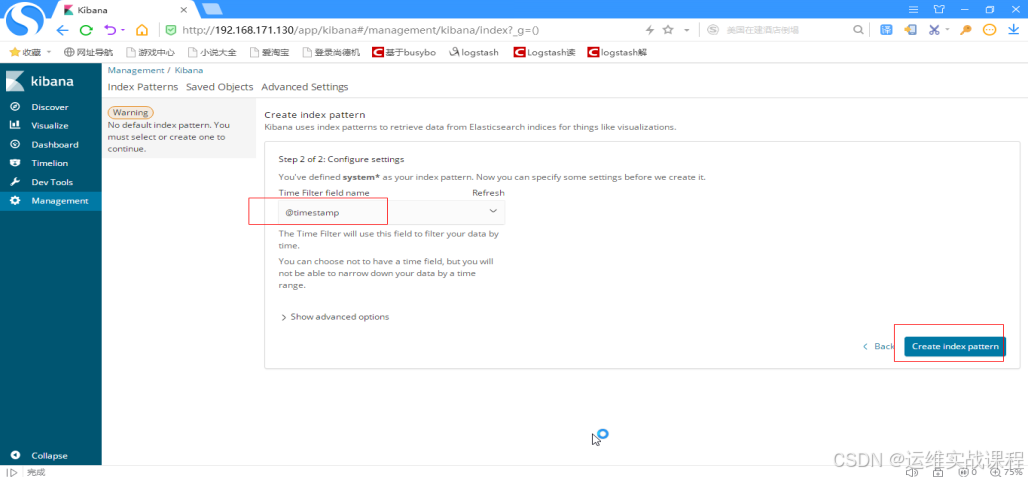
选择时间戳 @timestamp,点击create index pattern,如下:
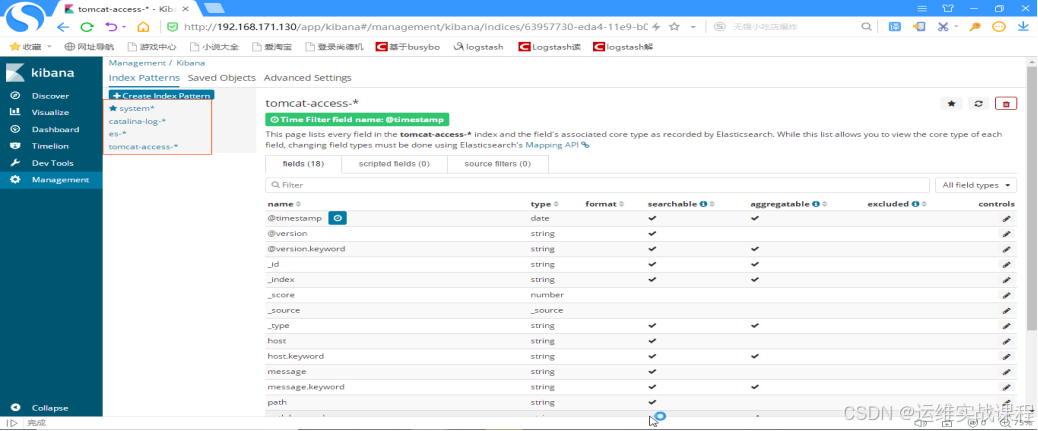
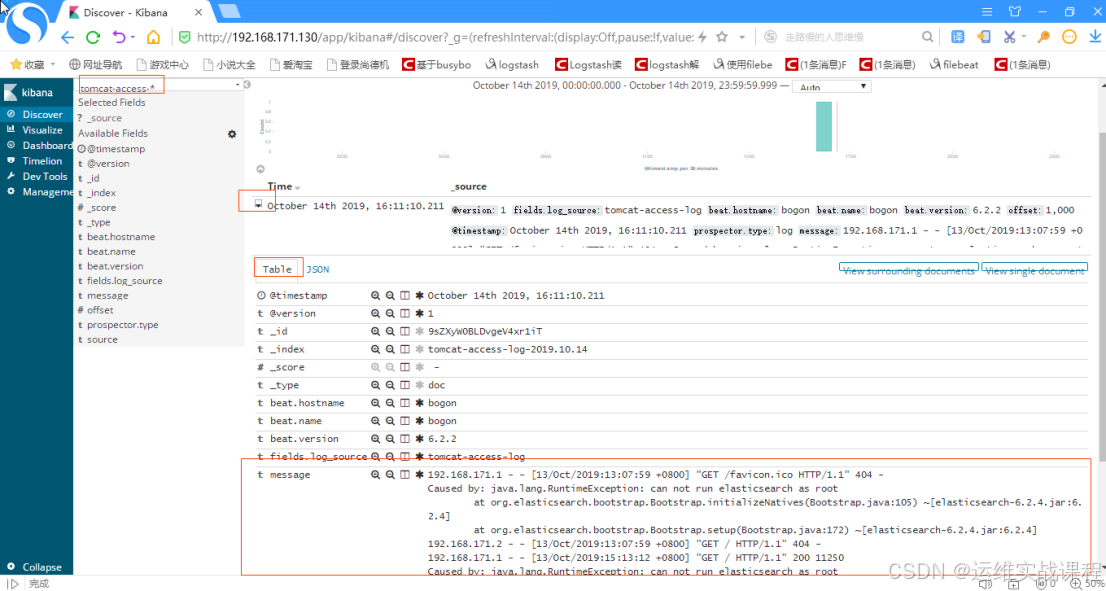
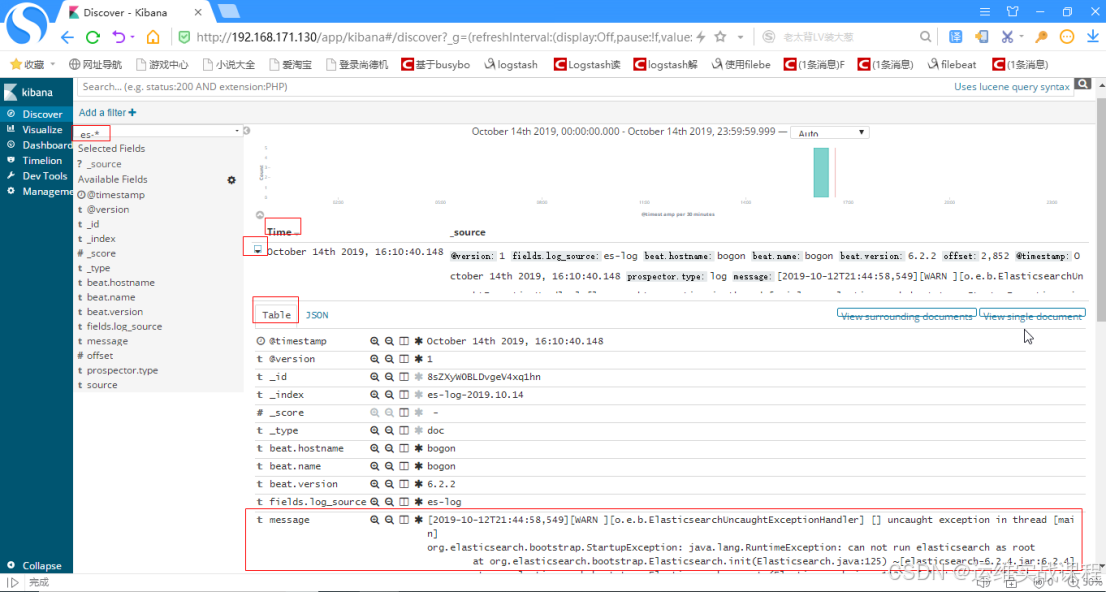
同理创建其他索引:catalina-log-* es-* tomcat-access-* 创建所有索引后如下:
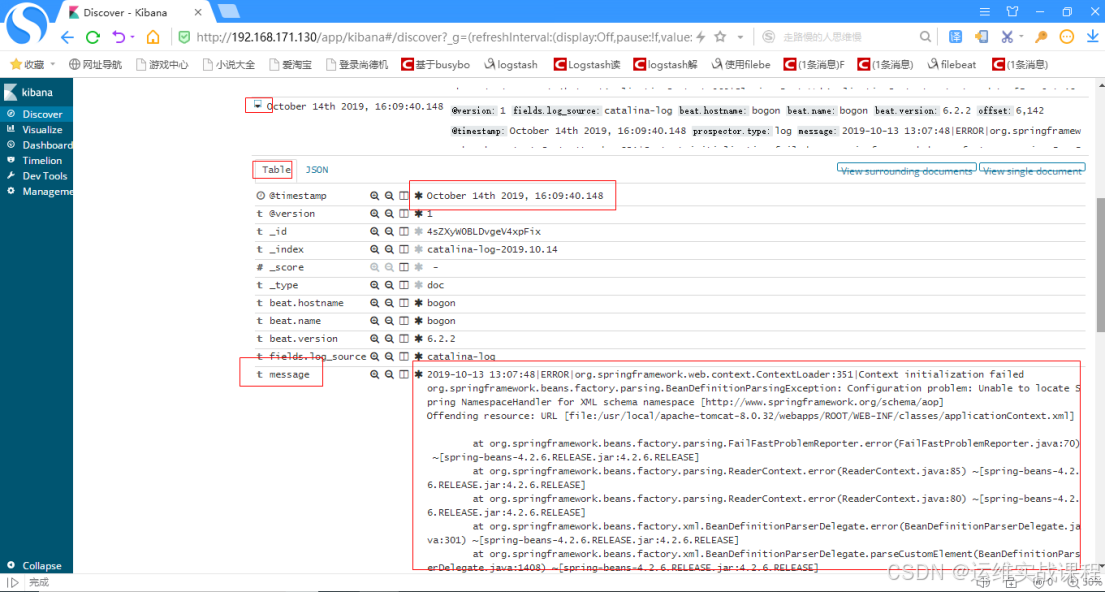
查看日志,点击discover,如下:
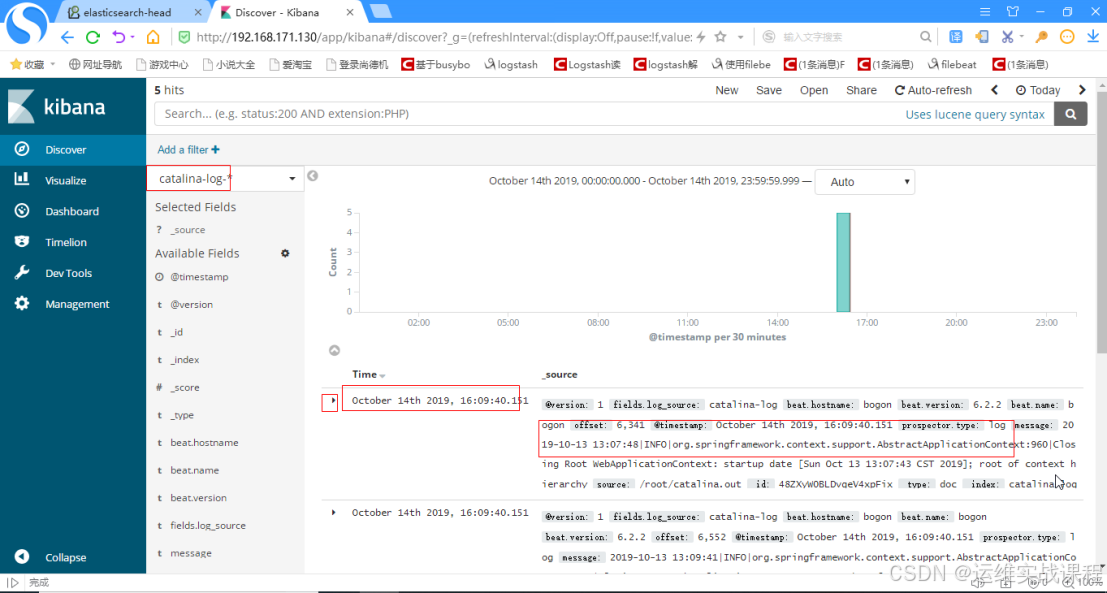
选择catalina-out日志,选择其中一条,点击向右箭头展开,如下:
(注意:上图是10月14号操作的,但日志的时间是10月13号的,专门这么操作为了区别,日志的时间和操作时间)
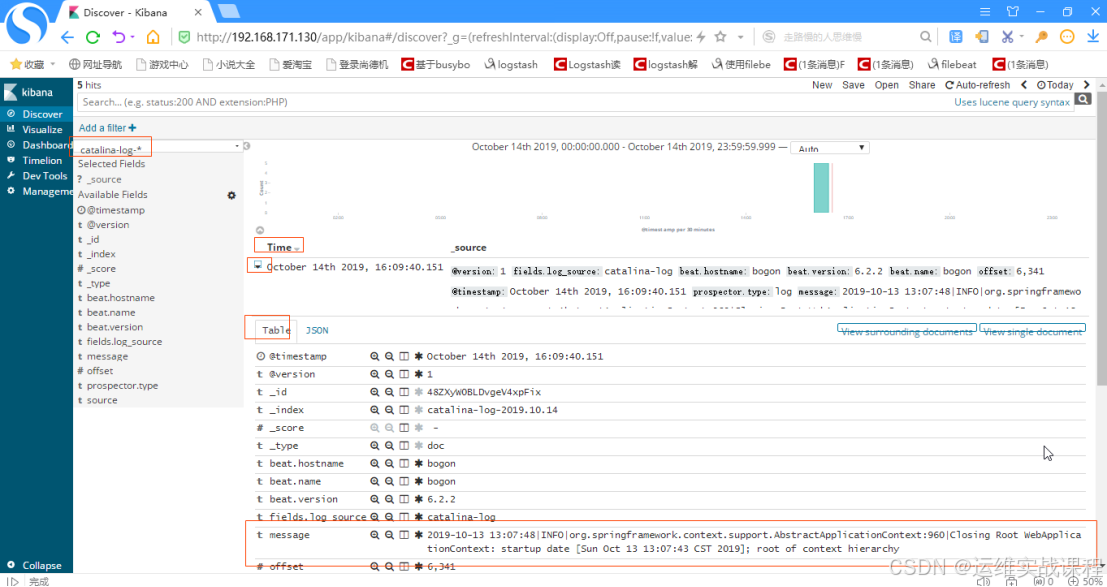
再选择一条展开,如下:
其他索引查看,都类似上面,注意需要展开才能查看到详细信息。
如果对运维课程感兴趣,可以在b站上、A站或csdn上搜索我的账号: 运维实战课程,可以关注我,学习更多免费的运维实战技术视频


 622
622

 被折叠的 条评论
为什么被折叠?
被折叠的 条评论
为什么被折叠?
 到【灌水乐园】发言


