


来源
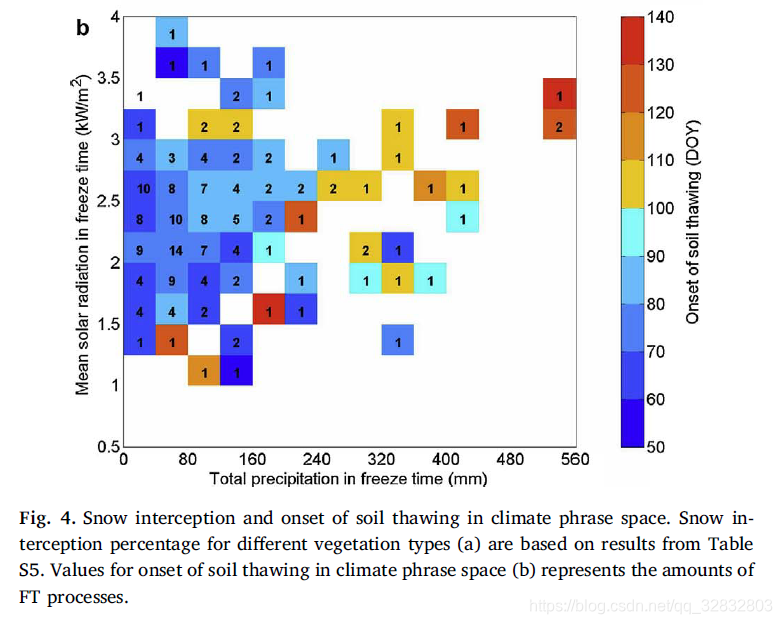
Guo, W., et al., Vegetation can strongly regulate permafrost degradation at its southern edge through changing surface freeze-thaw processes. Agricultural and Forest Meteorology, 2018. 252: p. 10-17.
解释
用数字表示矩阵内包含的点数,颜色表示另外一个数据。
复现图
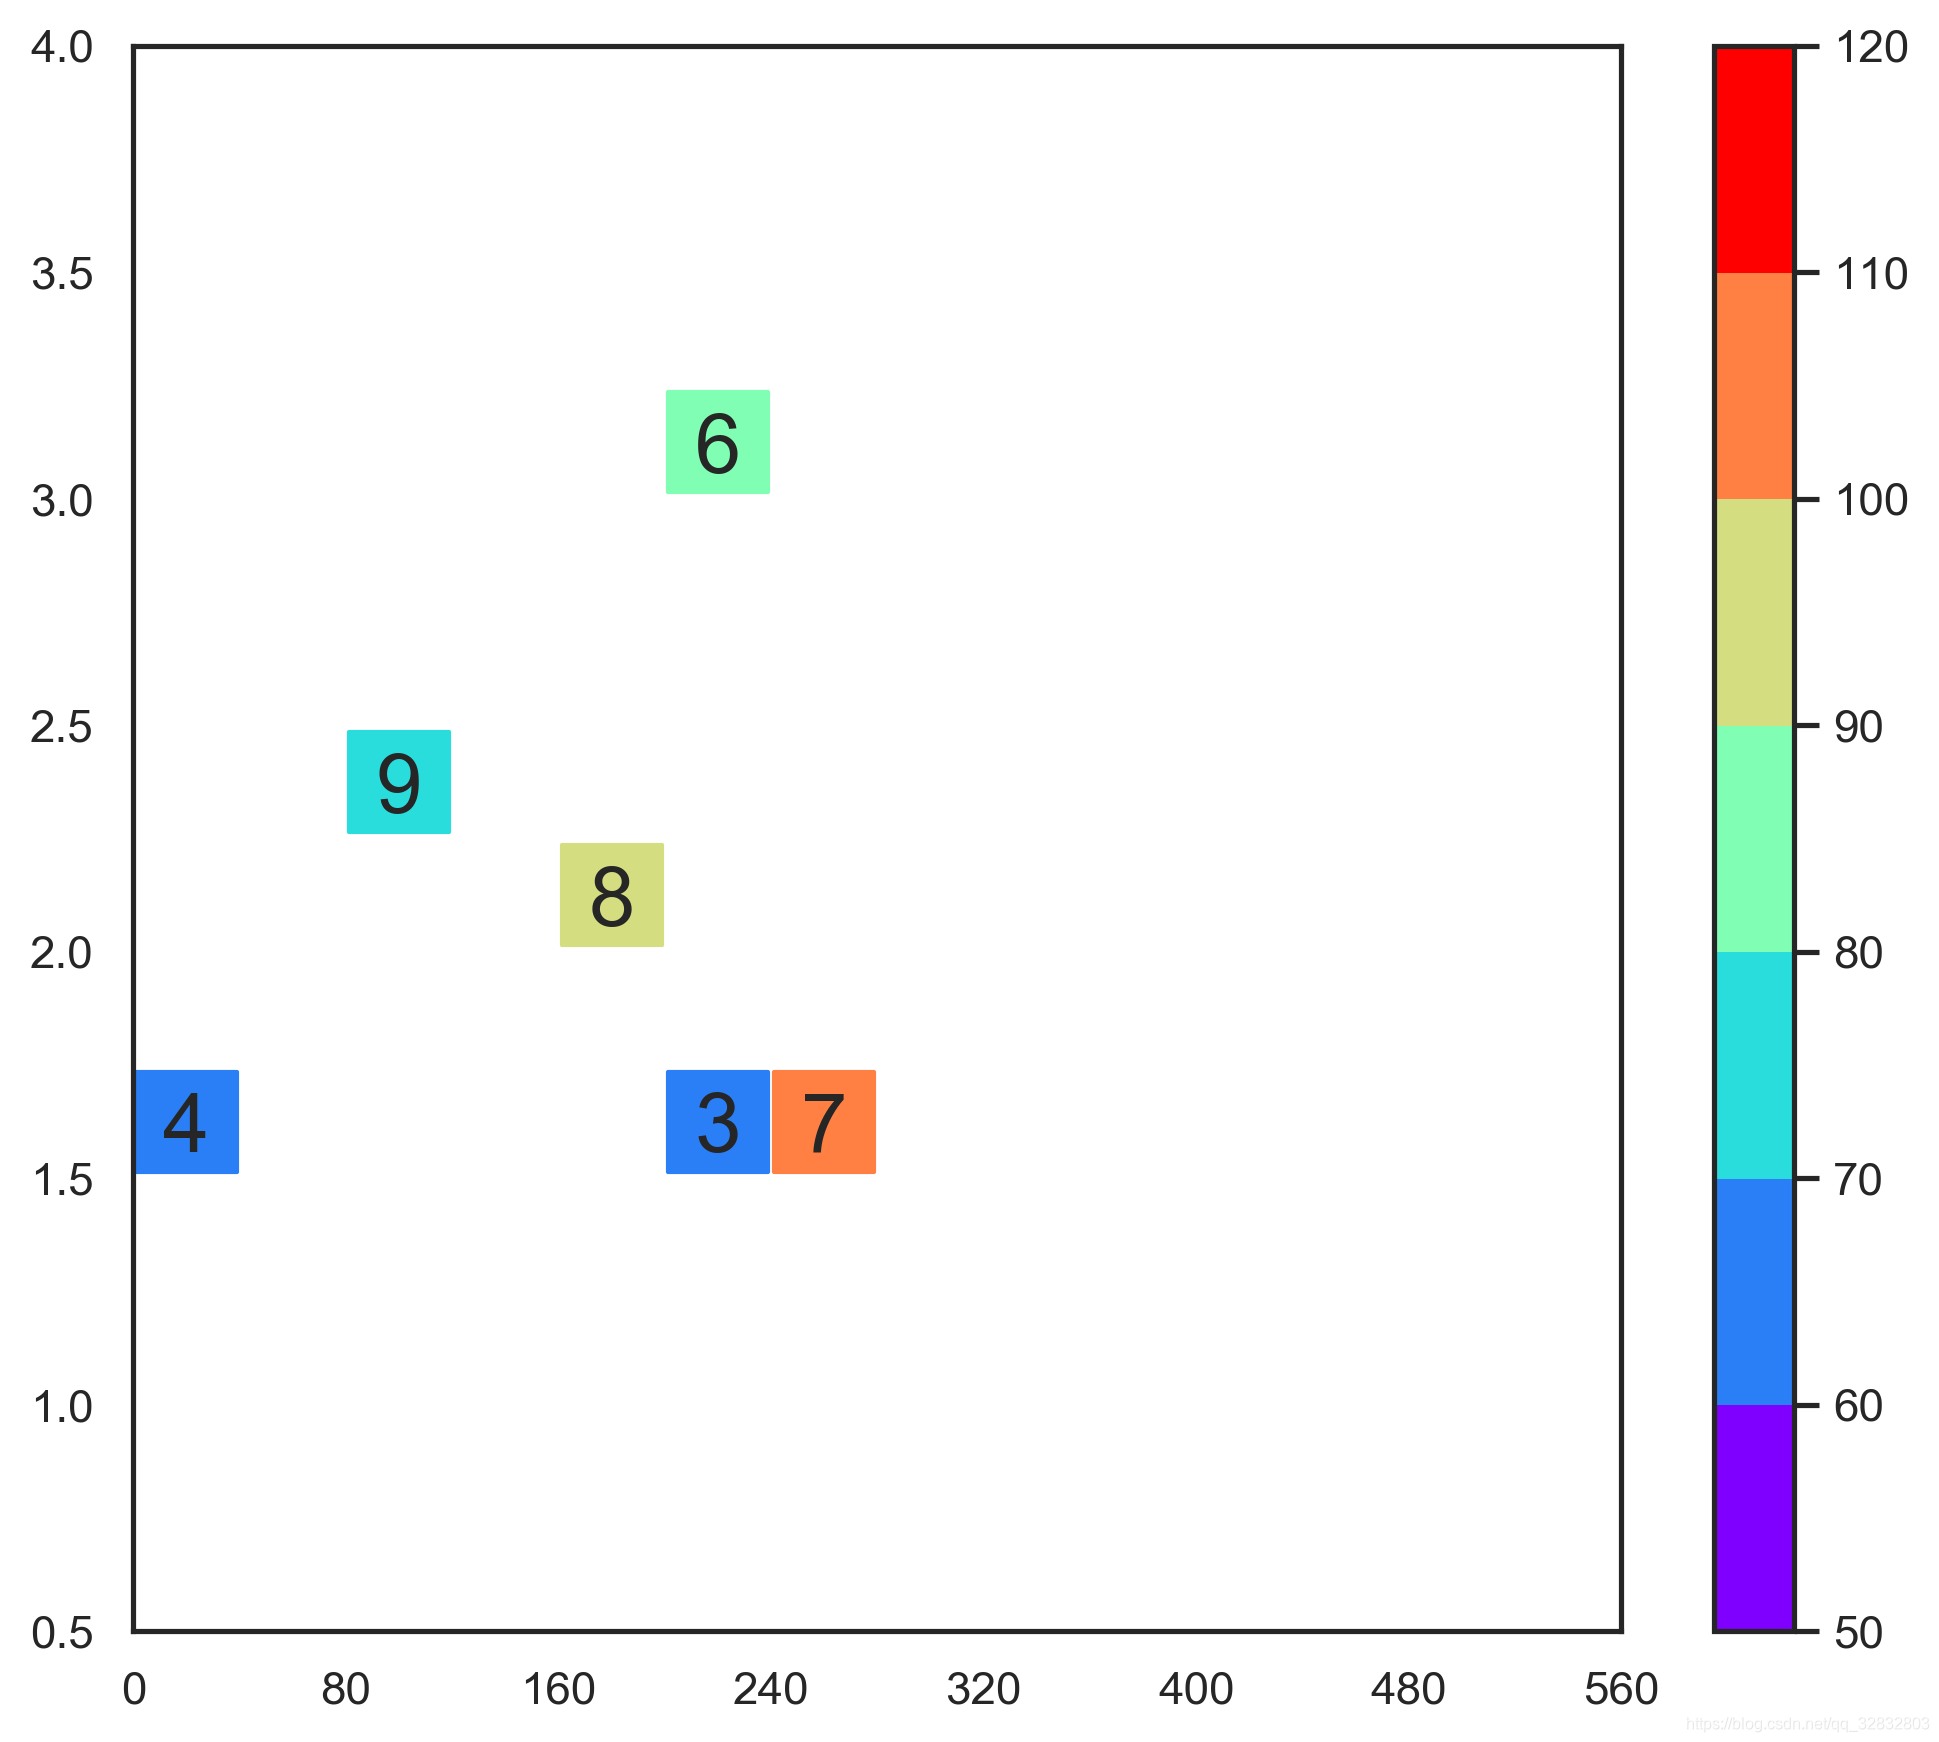
复现代码(python)
import matplotlib.pyplot as plt
import numpy as np
from matplotlib.pyplot import MultipleLocator

#------数据需要先自行准备好------
x = (0,80,160,200,200,240)
y = (1.5,2.25,2,3,1.5,1.5)
c = (63,78,94,85,64,108)
t = (4,9,8,6,3,7)
#------数据准备------

fig = plt.figure()
fig, ax = plt.subplots(1, 1,figsize=(8,7),dpi=300)

#------xy轴刻度间隔-----
x_major_locator=MultipleLocator(80)
y_major_locator=MultipleLocator(0.5)
ax.xaxis.set_major_locator(x_major_locator)
ax.yaxis.set_major_locator(y_major_locator)

#------点中心位置------
x = [a + 20 for a in x]
y = [a + 0.125 for a in y]

#------绘图------
cm = plt.cm.get_cmap('rainbow',7) #分为7级
sc = plt.scatter(x, y, marker=',',s=580,
                 c=c, vmin=50, vmax=120, cmap=cm)
#-----加上数字标签------
for i in range(len(x)):
    ax.text(x[i], y[i]-0.02, t[i], size=20, va="center", ha="center")

ax.set(xlim=(0,560),ylim=(0.5,4))
plt.colorbar(sc)

plt.show()


 5万+
5万+

 被折叠的 条评论
为什么被折叠?
被折叠的 条评论
为什么被折叠?
 到【灌水乐园】发言


