import numpy as np
from sklearn import cluster
from skimage.io import imread
from skimage.color import rgb2gray
from scipy.misc import imresize
import matplotlib.pyplot as plt
im = imresize(imread('./9781789343731_Code/images/banana.png'), (100, 100, 3))
img = rgb2gray(im)
plt.imshow(img, cmap=plt.gray())
plt.show()
k = 2
X = np.reshape(im, (-1, im.shape[-1]))
two_means = cluster.MiniBatchKMeans(n_clusters=k, random_state=10)
two_means.fit(X)
y_pred = two_means.predict(X)
labels = np.reshape(y_pred, im.shape[:2])
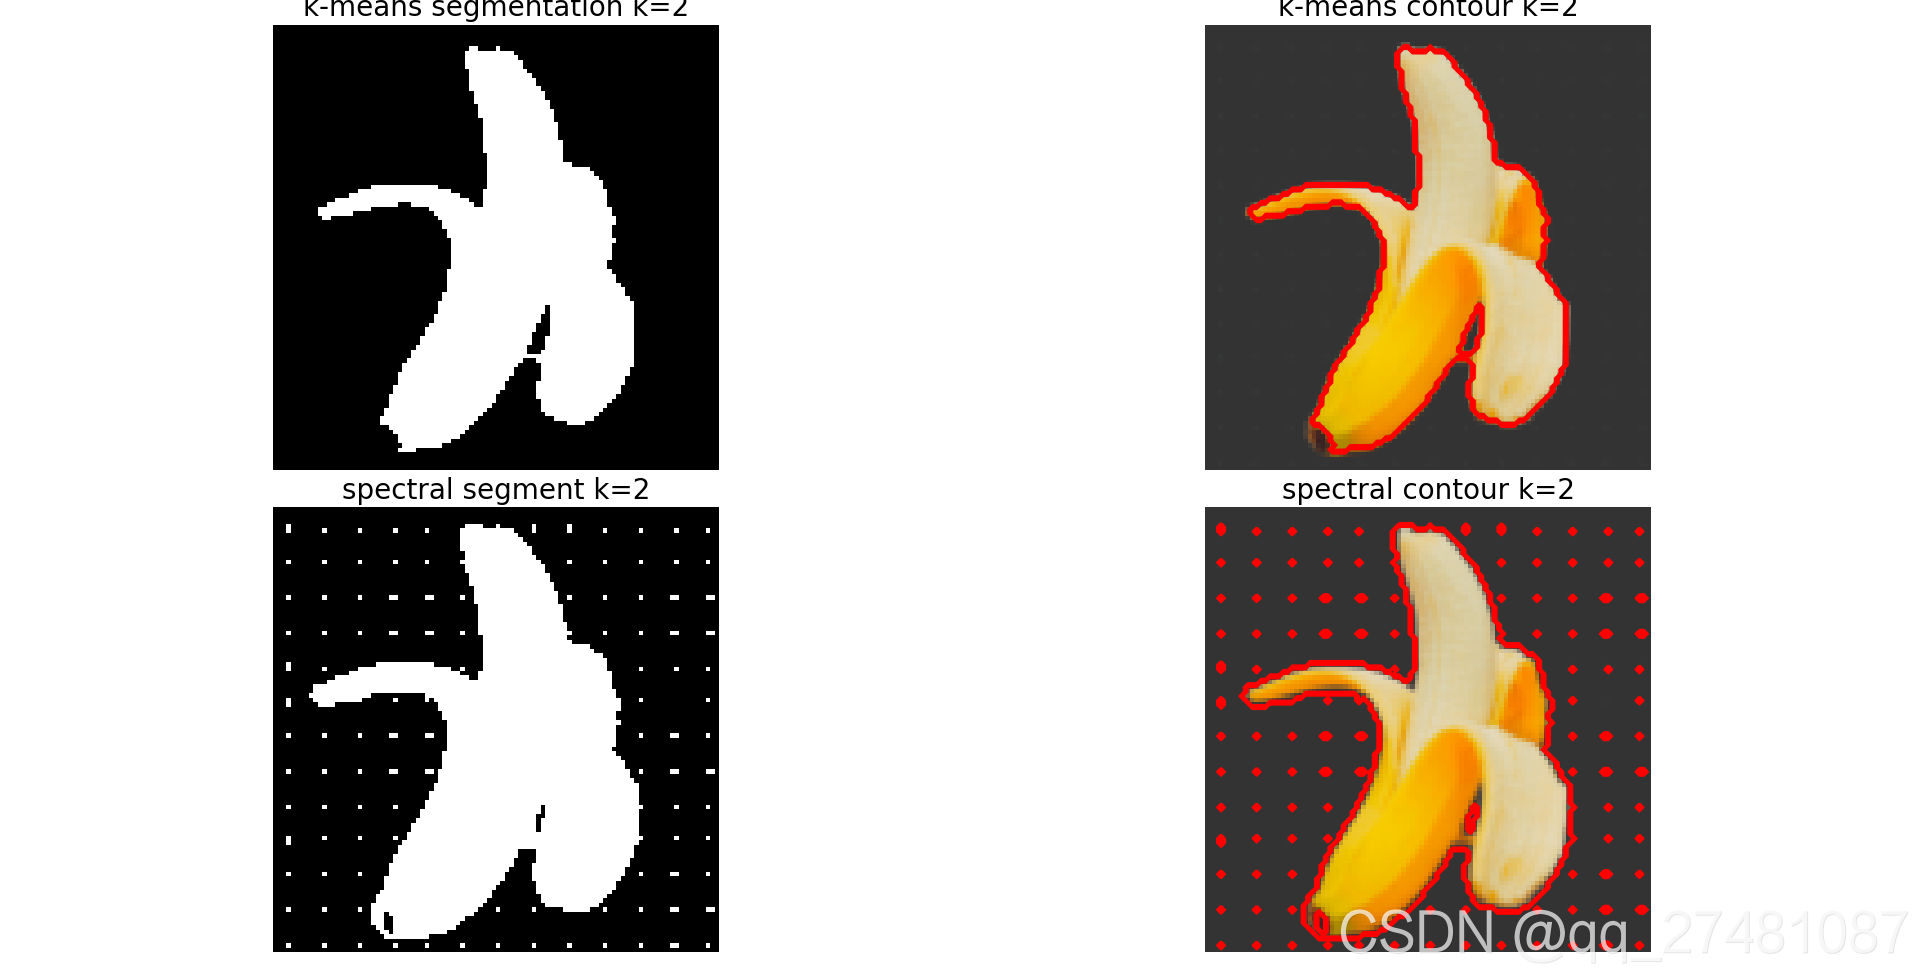
plt.figure(figsize=(20, 18))
plt.subplot(221)
plt.axis('off')
plt.imshow(np.reshape(y_pred, im.shape[:2]))
plt.title('k-means segmentation k=2', size=20)
plt.subplot(222)
plt.imshow(im)
plt.contour(labels==0, contours=1, colors='red')
plt.axis('off')
plt.title('k-means contour k=2', size=20)
spectral = cluster.SpectralClustering(n_clusters=k, eigen_solver='arpack',
affinity='nearest_neighbors',
n_neighbors=100,
random_state=10)
spectral.fit(X)
y_pred = spectral.labels_.astype(np.int)
labels = np.reshape(y_pred, im.shape[:2])
plt.subplot(223)
plt.axis('off')
plt.imshow(np.reshape(y_pred, im.shape[:2]))
plt.title('spectral segment k=2', size=20)
plt.subplot(224),plt.imshow(im),plt.axis('off')
plt.contour(labels==0,contours=1,colors='red')
plt.axis('off')
plt.title('spectral contour k=2', size=20)
plt.tight_layout()
plt.show()


 2667
2667

 被折叠的 条评论
为什么被折叠?
被折叠的 条评论
为什么被折叠?
 到【灌水乐园】发言


