


可复制:121202538
中文社区:http://thingsboard.org.cn
介绍
The goal of this guide is for you to collect and visualize some IoT device data using ThingsBoard. This guide will let you:
Provision your device
Manage device credentials
Push data from device to your ThingsBoard instance using MQTT, CoAP or HTTP protocols
Create dashboard to visualize the data
该指南旨在通过以下方式帮助您使用ThingsBoard采集IoT设备数据以及完成数据可视化。
置备设备。
管理设备凭证。
使用MQTT, CoAP 或者HTTP协议将设备数据添加到ThingsBoard实例。
创建仪表盘实现数据可视化。
设置和需求
If you don’t have access to a running ThingsBoard instance, use either Live Demo or Installation Guide to fix this.
如果你无法访问正在运行中的ThingsBoard实例,可查阅在线演示Live Demo或安装指南进行修复。
演示账号
All ThingsBoard installations are equipped with a demo account that simplifies the first user experience. This demo account contains several pre-provisioned devices, dashboards, rules, and plugins installed. Please note that you are free to delete this account in the production deployment.
所有的ThingsBoard都配置了一个演示帐号,简化了第一次用户体验。这个演示帐户包含了几个预先置备的设备、仪表盘、规则和插件。请注意,您可以在生产部署中删除该帐户。
You can use ThingsBoard device emulators to simulate real-life devices and play-around with server-side APIs, data visualization, and processing logic.
您可以使用ThingsBoard设备仿真器来模拟真实的设备,并使用服务器端api、数据可视化和处理逻辑进行模拟。
We will use these emulators in advanced tutorials, however, the for the purpose of this guide, we will just use pre-provisioned tenant administrator account.
在高级教程中,我们将使用这些模拟器,但是,出于本指南的目的,我们将使用预先配置的租户管理员帐户。
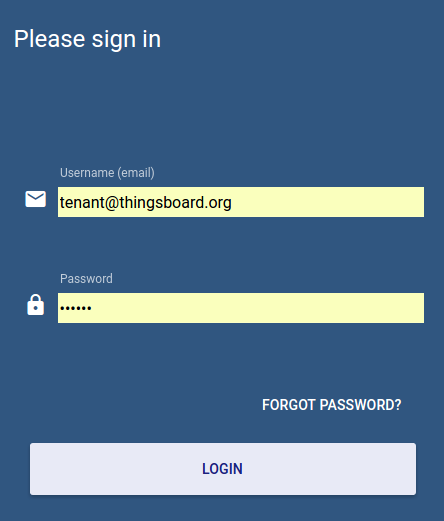
登录租户管理账户
The first step is to login into administration Web UI. If you are using local ThingsBoard installation you can login to administration Web UI using default account:
Username: tenant@thingsboard.org
Password: tenant
第一步是登录到管理界面。 如果你使用的是本地ThingsBoard安装,你可以使用默认账户登录到管理界面:
If you are using Live Demo you can login to Live Demo server using Tenant Administrator account (the one that you created during sign-up).
如果你使用的是在线演示点击这里查看:Live Demo账号,你可以使用租户管理账号(你之前创建的账号)登录在线演示服务器。
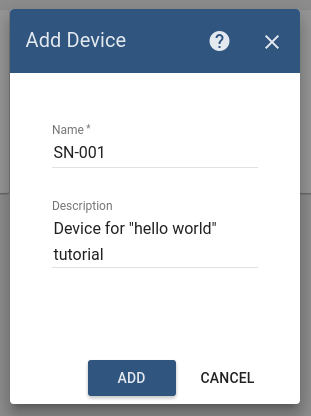
添加设备
Open Devices panel and click on “+” button in the bottom-right corner of the page.
打开设备面板(Devices panel)点击右下角“+”

Populate and save device name (for example, “SN-001”). It will be referred to later as $DEVICE_NAME. Device names must be unique. Populating device name based on a unique serial number or other device identifier is generally a good idea. Click “Add” button will add corresponding device card to the panel.
填写并保存设备名称(例如,“SN-001”)。下文中被称作$DEVICE_NAME。设备名称必须是唯一的。建议根据惟一的序列号或其他设备标识符填写设备名称。单击“Add”按钮将向面板添加相应的设备卡。
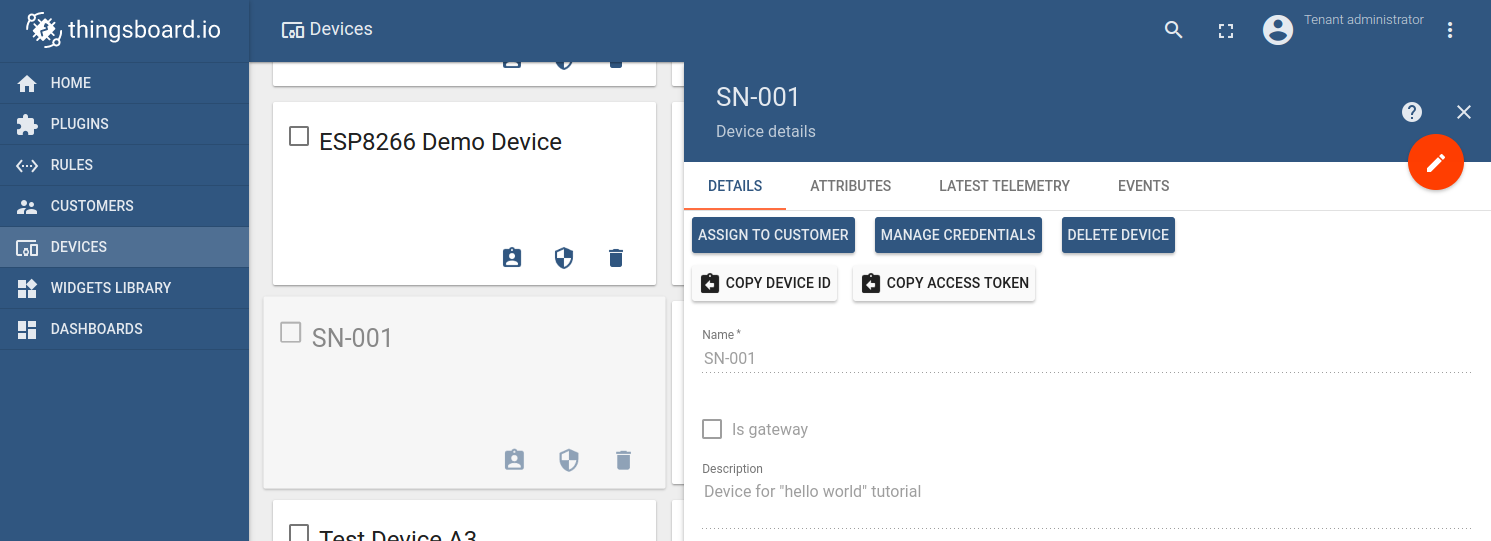
管理设备凭证
Click on the “device card” we have created in the previous step. This action will open “device details” panel. Click on the “manage credentials” button on the top of the panel. This action will open a popup window with device credentials.
点击上一步骤中创建的“device card”打开“device details”面板。 点击面板顶部“manage credentials”按钮弹出设备凭证弹窗。
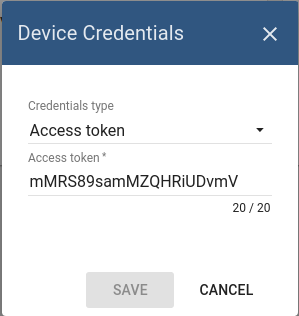
Device credentials window will show auto-generated device access token that you can change. Please save this device token. It will be referred to later as $ACCESS_TOKEN.
设备凭据窗口将显示自动生成的设备访问token,您可以更改它。请保存这个设备token。该token下文中被称为$ACCESS_TOKEN。
Congratulations! You have just provisioned your first device! Now you can push some data from this device to ThingsBoard for visualization and analysis.
恭喜您,您刚才完成了第一个设备置备!现在你可以将该设备的数据传递到ThingsBoard实现可视化并进行分析了。
传递设备数据
In order to simplify this guide, we will push data using MQTT, CoAP or HTTP protocol from your local PC. Please refer to samples for advanced examples of for various hardware platforms.
为了简化这个指南,我们将使用来自本地PC的MQTT、CoAP或HTTP协议来传递数据。有关各种硬件平台的高级示例,请参考samples。
客户端库安装
Install preferred MQTT (Mosquitto or MQTT.js), CoAP (CoAP.js) or HTTP (cURL) client using following commands.
使用以下命令安装MQTT (Mosquitto or MQTT.js), CoAP (CoAP.js) or HTTP (cURL) 客户端。
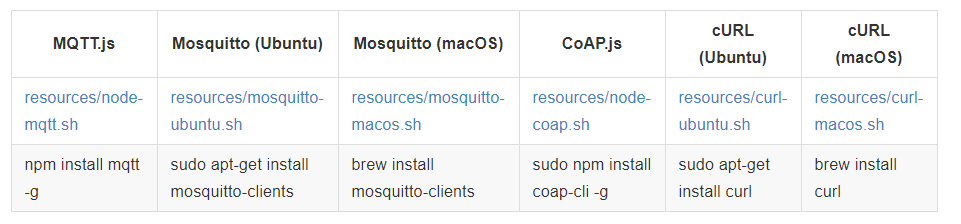
下面是表格中的文本:
MQTT.js	Mosquitto (Ubuntu)	Mosquitto (macOS)	CoAP.js	cURL (Ubuntu)	cURL (macOS)
resources/node-mqtt.sh	resources/mosquitto-ubuntu.sh	resources/mosquitto-macos.sh	resources/node-coap.sh	resources/curl-ubuntu.sh	resources/curl-macos.sh
npm install mqtt -g	sudo apt-get install mosquitto-clients	brew install mosquitto-clients	sudo npm install coap-cli -g	sudo apt-get install curl	brew install curl
示例数据文件
Create some folder to store all necessary files for this tutorial. Download to this folder or create the following data files:
attributes-data.json - contains two device attributes values: firmware version and serial number.
telemetry-data.json - contains three time-series values: temperature, humidity and active flag.
创建一个文件夹存放该指南需要的文件。将文件下载到该文件夹或者创建以下数据文件
attributes-data.json - 包含两个设备属性值:固件版本和序列号。
telemetry-data.json - 包含三个时间序列值:temperature, humidity and active flag。
Please note that data in this files is basically in key-value format. You can use your own keys and values. See MQTT, CoAP or HTTP protocol reference for more details.
请注意,这些文件的数据是以键-值方式存储。你可以使用自定义键值。
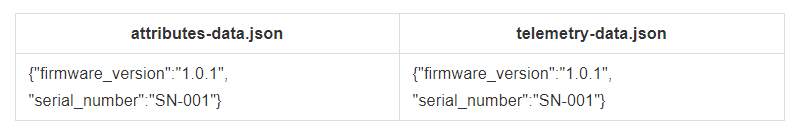
下面是表格中的文本:
attributes-data.json	telemetry-data.json
{"firmware_version":"1.0.1", "serial_number":"SN-001"}	{"firmware_version":"1.0.1", "serial_number":"SN-001"}
使用MQTT, CoAP or HTTP传送数据
Download the following files to previously created folder according to the preferred client:
根据首选客户端下载以下文件到之前创建的文件夹:
**MQTT.js (MQTT)**
[mqtt-js.sh](https://raw.githubusercontent.com/thingsboard/thingsboard.github.io/master/docs/getting-started-guides/resources/mqtt-js.sh) (Ubuntu & MacOS) or [mqtt-js.bat](https://raw.githubusercontent.com/thingsboard/thingsboard.github.io/master/docs/getting-started-guides/resources/mqtt-js.bat)(Windows)
[publish.js](https://raw.githubusercontent.com/thingsboard/thingsboard.github.io/master/docs/getting-started-guides/resources/publish.js)
**Mosquitto (MQTT)**
[mosquitto.sh](https://raw.githubusercontent.com/thingsboard/thingsboard.github.io/master/docs/getting-started-guides/resources/mosquitto.sh)
**CoAP.js (CoAP)**
[coap-js.sh](https://raw.githubusercontent.com/thingsboard/thingsboard.github.io/master/docs/getting-started-guides/resources/coap-js.sh)
**cURL (HTTP)**
[curl.sh](https://raw.githubusercontent.com/thingsboard/thingsboard.github.io/master/docs/getting-started-guides/resources/curl.sh)
If you are using a shell script (*.sh) make sure that it is executable:
如果您使用的是shell脚本(.sh),请确保它是可执行的:
chmod +x *.sh
Before executing script don’t forget to:
replace $ACCESS_TOKEN with one from Device credentials window.
replace $THINGSBOARD_HOST with either 127.0.0.1 (in case of local installation) or demo.thingsboard.io (in case of live-demo).
执行脚本之前请记住:
使用设备凭证窗口的访问token替换
A
C
C
E
S
S
T
O
K
E
N
。
使
用
127.0.0.1
(
本
地
安
装
)
或
者
d
e
m
o
.
t
h
i
n
g
s
b
o
a
r
d
.
i
o
(
在
线
演
示
)
替
换
ACCESS_TOKEN。 使用127.0.0.1 (本地安装) 或者demo.thingsboard.io (在线演示)替换
ACCESSTOKEN。使用127.0.0.1(本地安装)或者demo.thingsboard.io(在线演示)替换THINGSBOARD_HOST。
Finally, execute corresponding .sh or .bat script to push data to the server.
最后,执行相应的.sh 或者.bat脚本向服务器传送数据。
Below are tabs with the content of the scripts provided.
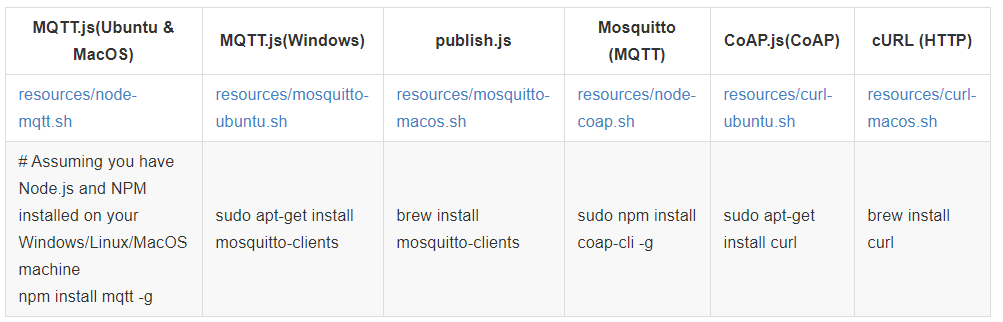
下面是图中表格的数据:
MQTT.js(Ubuntu & MacOS)	MQTT.js(Windows)	publish.js	Mosquitto (MQTT)	CoAP.js(CoAP)	cURL (HTTP)
resources/node-mqtt.sh	resources/mosquitto-ubuntu.sh	resources/mosquitto-macos.sh	resources/node-coap.sh	resources/curl-ubuntu.sh	resources/curl-macos.sh
# Assuming you have Node.js and NPM installed on your Windows/Linux/MacOS machine
npm install mqtt -g	sudo apt-get install mosquitto-clients	brew install mosquitto-clients	sudo npm install coap-cli -g	sudo apt-get install curl	brew install curl
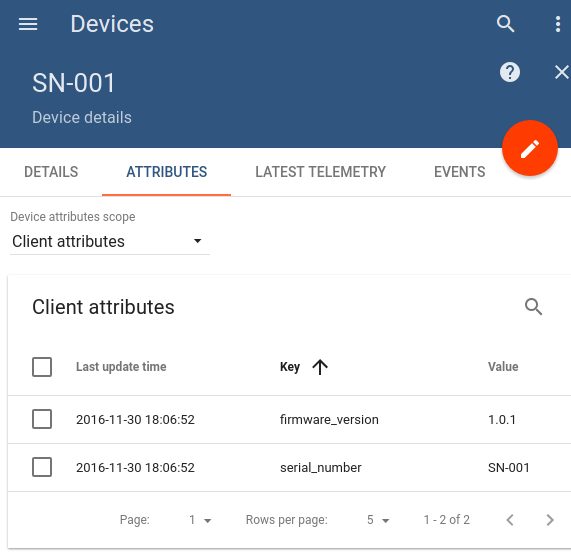
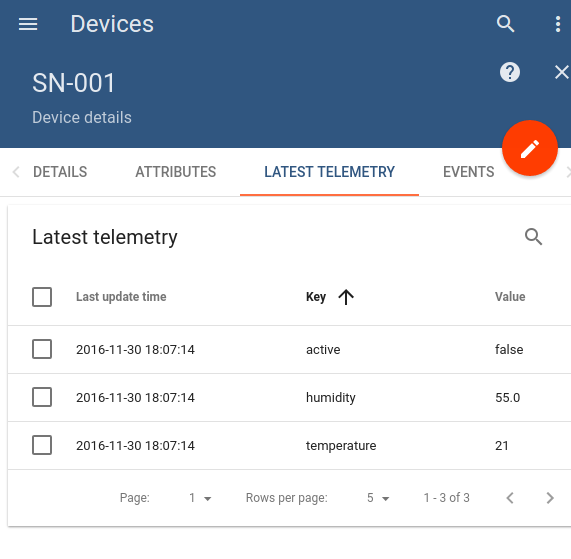
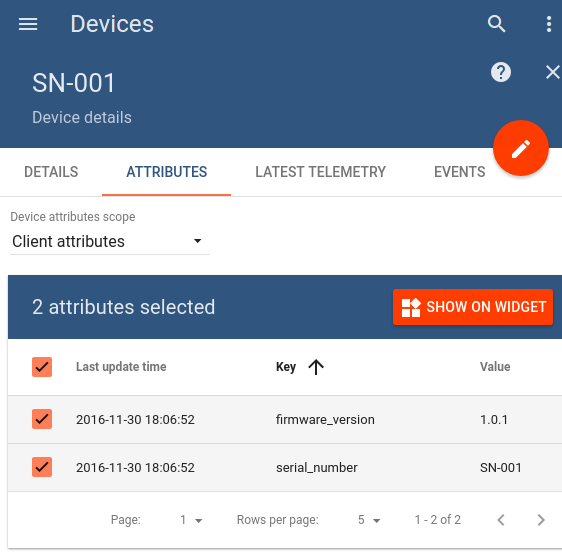
在Web界面观察数据
Once you execute commands listed above you should see attributes and latest telemetry data in corresponding device detail tabs.
执行完上述命令后,你可以在对应的设备详情列看到属性和最新遥测数据。
创建新仪表盘使数据可视化
The easiest way to create new dashboard is to select device attributes and show them on widget
最简单的创建新仪表盘的方式是选择设备属性并在小部件上展示这些选中的属性。
Once you click on “Show on widget” button, you will see a “widget preview” panel where you can
Select widget bundle
Select preferred widget
Add widget to new or existing dashboard
点击“Show on widget”按钮以后,显示“widget preview”面板,在该面板中可进行如下操作:
选择小部件包。
选择首选小部件*
将小部件添加到新的或者已存在的仪表盘中。
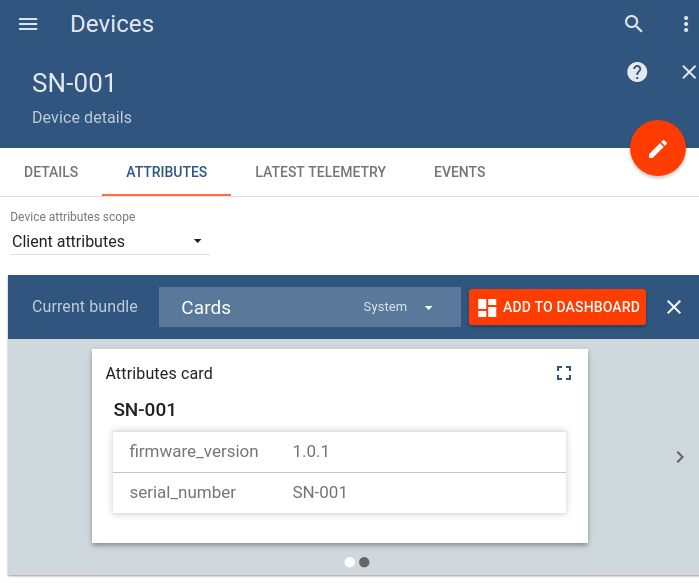
Let’s add our first widget to new dashboard named “SN-001 Dashboard”
我们将第一个小部件添加到名为“SN-001 Dashboard”的仪表盘上。

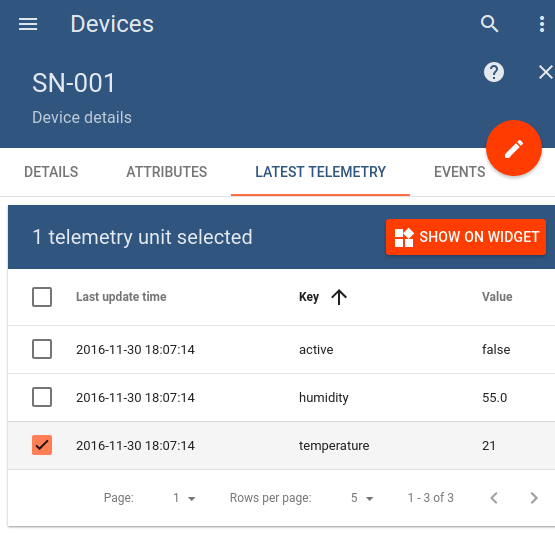
Let’s also add widget to visualize temperature
添加小部件来可视化温度。
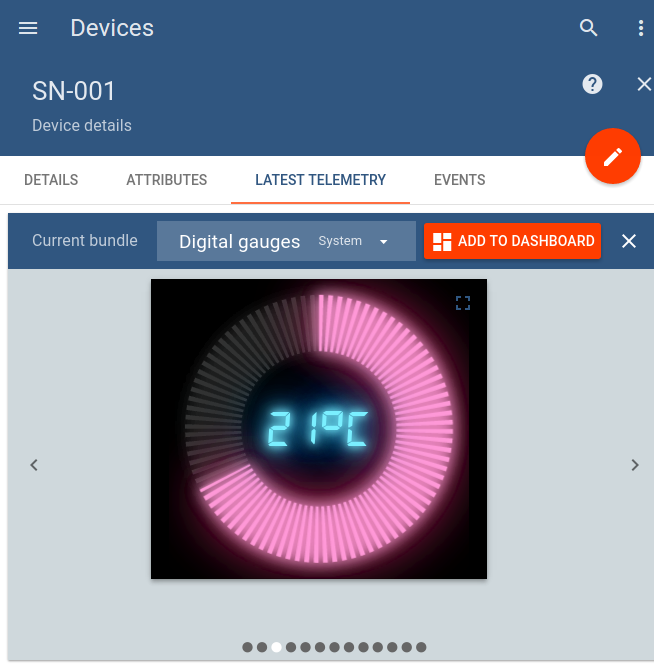
Click Show on widget and select Digital gauges bundle. Use carousel to select thermometer widget as shown below.
点击“Show on widget”并选择“Digital gauges”。使用carousel(旋转进度条)来选择温度计小部件,如下所示。
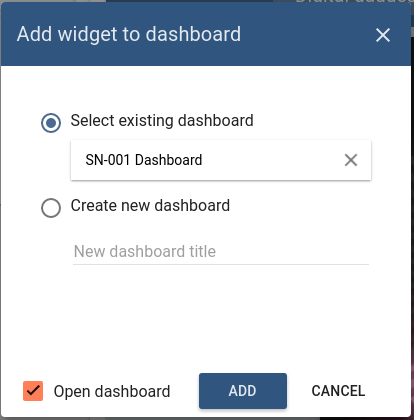
Please note that in this case, we will add a widget to an already existing dashboard. We will also select “Open dashboard” option to see results of our work.
请注意,在此示例中我们将为已经存在的仪表盘添加小部件。我们仍然选择的是“Open dashboard”选项来查看结果。
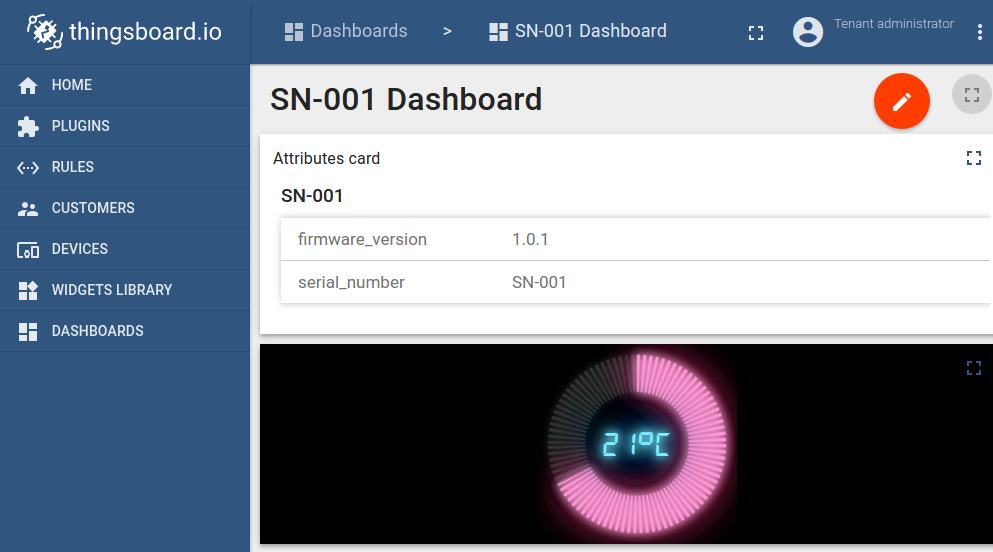
Finally, we are able to see our new dashboard. Now we can edit the dashboard to
Configure dashboard settings
Tune widget sizes and layout
Modify advanced settings of individual widget
Add new widgets or remove existing
Widgets import/export
最后,我们可以查看我们的新仪表盘了。我们可以编辑仪表盘进行如下操作:
配置仪表盘设置
调节小部件的尺寸和布局。
修改每一个小部件的高级设置。
添加或者移除小部件。
小部件导入/导出。
Next steps
Explore guides related to main ThingsBoard features:
Device attributes - how to use device attributes.
Telemetry data collection - how to collect telemetry data.
Using RPC capabilities - how to send commands to/from devices.
Rule Engine - how to use rule engine to analyze data from devices.
Data Visualization - how to visualize collected data.


 3991
3991

 被折叠的 条评论
为什么被折叠?
被折叠的 条评论
为什么被折叠?
 到【灌水乐园】发言


