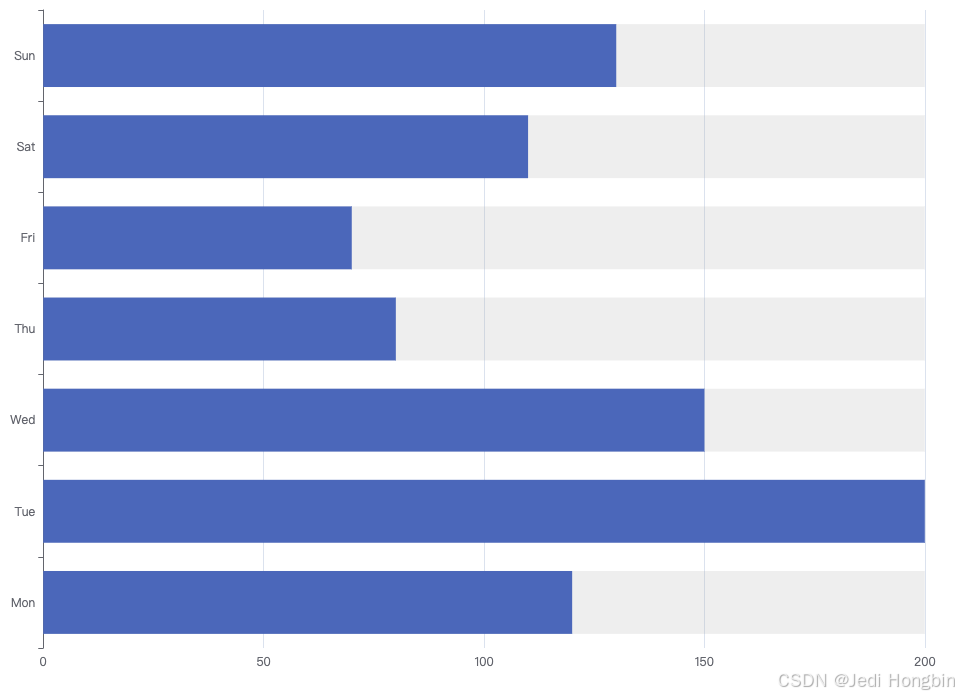
echarts自定义图表--柱状图-横向

在这里插入图片描述

在这里插入图片描述

区别于纵向表格
xAxis和yAxis对调
要将label全部固定到最右侧: 隐藏一个柱形 为每个label设置固定的偏移距离 offset: [300 - 80, 0]
在data中加入label的配置 根据现在的值生成距离右侧的偏移

更新方法

chart.setOption({
     series: [
          {},
          {
              data: data.map(v => ({
                  value: offset,
                  label: {
                      show: true,
                      position: "right",
                      color: "#00D753",
                      fontWeight: "bold",
                      fontSize: fontSize,
                      formatter: `${v}`,
                      fontFamily: "MyCustomFont",
                      fontStyle: "italic",
                      distance: 0,
                      offset: [300 - 80, 0],
                  },
              })),
          },
          {
              data,
          },
      ],
  })
 data: data.map(v => ({
       value: offset,
        label: {
            show: true,
            position: "right",
            color: "#00D753",
            fontWeight: "bold",
            fontSize: fontSize,
            formatter: `${v}`,
            fontFamily: "MyCustomFont",
            fontStyle: "italic",
            distance: 0,
            offset: [300 - 80, 0],
        },
    })),
<!DOCTYPE html>
<html style="height: 100%; background: #000">
    <head>
        <meta charset="utf-8" />
        <title>发光柱状图</title>
        <script src="https://cdn.jsdelivr.net/npm/echarts@5"></script>
        <style>
            /* 在 CSS 文件中定义自定义字体 */
            @font-face {
                font-family: "MyCustomFont"; /* 自定义字体名称 */
                src: url("public/只含数字.ttf");
                font-weight: normal;
                font-style: normal;
            }
        </style>
    </head>
    <body
        style="background: #000; height: 100vh; overflow: hidden; padding: 200px">
        <div
            id="main"
            style="height: 200px; width: 300px"></div>
        <script>
            const chart = echarts.init(document.getElementById("main"));

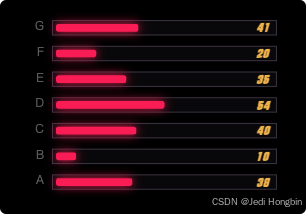
            const data = [38, 10, 40, 54, 35, 20, 41];
            const categories = ["A", "B", "C", "D", "E", "F", "G"];
            const redBarOffset = 2;
            // 最大值为100时 如下 增加 下方空隙 + 上方label
            const maxBarValue = 100 + redBarOffset + 10;

            const fontSize = 12;

            const option = {
                backgroundColor: "transparent",
                yAxis: {
                    type: "category",
                    data: categories,
                    axisLine: { lineStyle: { color: "transparent" } },
                    axisLabel: {
                        color: "#666",
                        fontSize: fontSize,
                    },
                },
                xAxis: {
                    show: false,
                    max: maxBarValue + redBarOffset + 10,
                },
                grid: {
                    left: "12%",
                    right: "5%",
                    bottom: "5%",
                    top: "5%",
                },
                series: [
                    // 金色背景柱
                    {
                        type: "bar",
                        data: Array(data.length).fill(maxBarValue),
                        barWidth: "60%",
                        itemStyle: {
                            color: "#453B4C22",
                            borderColor: "#453B4C",
                            borderWidth: 1,
                        },
                        z: 1,
                    },
                    // 占位透明柱(用于悬空红柱)
                    {
                        type: "bar",
                        data: data.map(v => ({
                            value: redBarOffset,
                            label: {
                                show: true,
                                position: "right",
                                color: "#00D753",
                                fontWeight: "bold",
                                fontSize: fontSize,
                                formatter: `${v}`,
                                fontFamily: "MyCustomFont",
                                fontStyle: "italic",
                                distance: 0,
                                offset: [300 - 80, 0],
                            },
                        })),
                        stack: "data",
                        barWidth: "30%",
                        itemStyle: {
                            color: "transparent",
                        },

                        z: 2,
                    },
                    // 红色柱子(真实数据)
                    {
                        type: "bar",
                        animationDuration: 1500,
                        animationEasing: "elasticOut",
                        data: data,
                        stack: "data",
                        barGap: "-75%",
                        itemStyle: {
                            color: "#F7225D",
                            shadowColor: "#F7225D",
                            shadowBlur: 10,
                            borderRadius: [2, 2, 2, 2],
                        },

                        z: 3,
                    }
                ],
            };

            chart.setOption(option);
        </script>
    </body>
</html>

评论
添加红包

请填写红包祝福语或标题

红包个数最小为10个

红包金额最低5元

当前余额3.43前往充值 >
需支付:10.00
成就一亿技术人!
领取后你会自动成为博主和红包主的粉丝 规则
hope_wisdom
发出的红包
实付
使用余额支付
点击重新获取
扫码支付
钱包余额 0

抵扣说明:

1.余额是钱包充值的虚拟货币,按照1:1的比例进行支付金额的抵扣。
2.余额无法直接购买下载,可以购买VIP、付费专栏及课程。

余额充值