```python
library(ggplot2)
library(RColorBrewer);
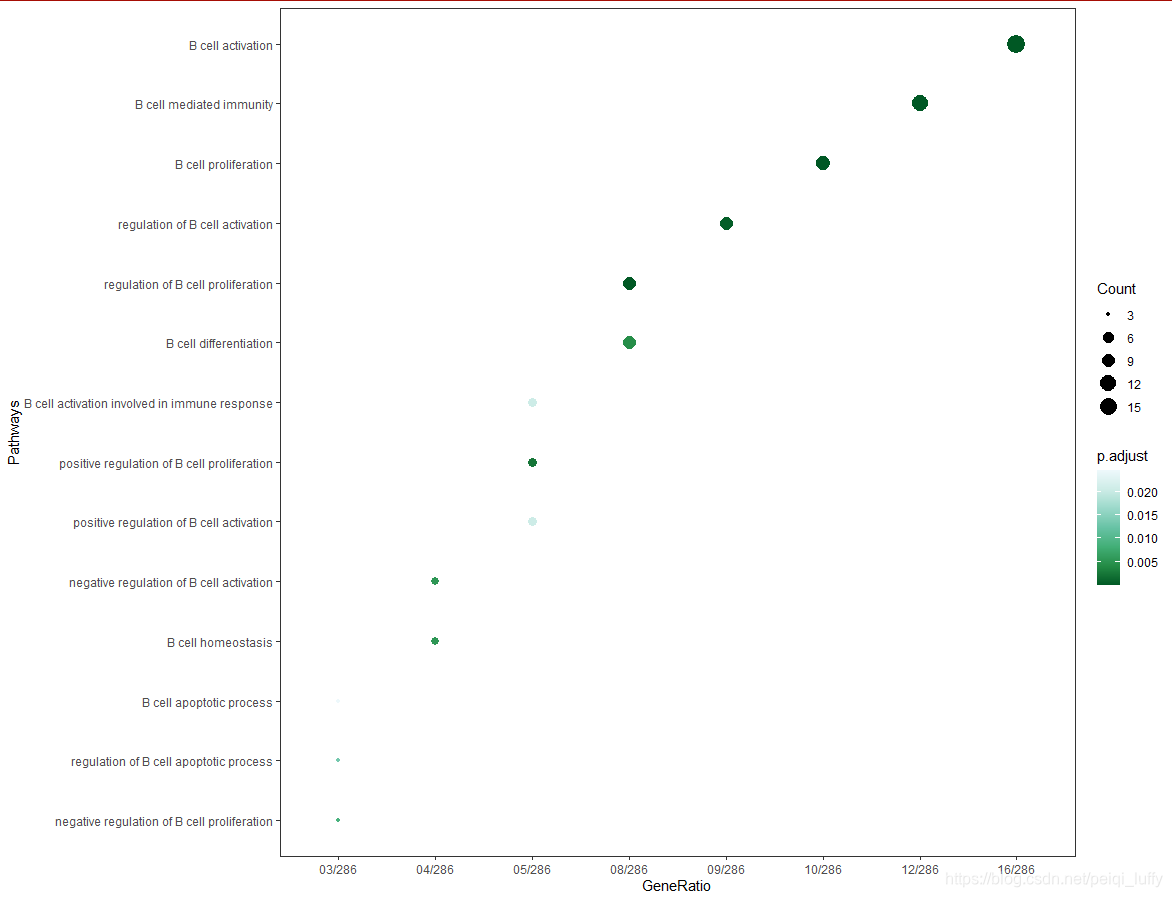
t.cell <- t.cell[order(t.cell$Count),]#按点的大小排序
t.cell$Description <- factor(t.cell$Description,levels = t.cell$Description)#对名称因子化方便排序按顺序来
p1 <-ggplot(data = t.cell,mapping = aes(x = Description, y = GeneRatio,size = Count)) +
geom_point(aes(colour = p.adjust),show.legend = TRUE) +
scale_color_distiller(palette = "Reds")+####set color
coord_flip()+
scale_x_discrete(limits = rev(levels(t.cell$Pathways))) +
theme_bw()+##set background
xlab("Pathways")+
theme(panel.grid.major=element_blank(),panel.grid.minor=element_blank())#移去网格线
p1
pdf("go.t.cell.pdf",width=11,height=8)
print(p1)
dev.off()


 被折叠的 条评论
为什么被折叠?
被折叠的 条评论
为什么被折叠?
 到【灌水乐园】发言


