


1、完整代码
<template>
  <div class="echarts-container">
    <h3>ECharts 自定义图例交互示例</h3>
    <div style="position: absolute;width:98%;border: 1px solid red;margin: 20px;">
      <div style="height:66vh;margin-top: 1vh;"
           ref="chartContainer"></div>
      <div style="position: relative;width: 100% !important;">
        <el-row>
          <el-col :span="24"
                  style="justify-items: center;">
            <div style="width: 600px;height: auto;">
              <div v-for="(item, index) in originalLegendData"
                   style="cursor: pointer;"
                   :key="item">
                <!-- 文字(添加颜色状态变化) -->
                <div style="width: 50px;float: left;"
                     :style="{ backgroundColor: isSeriesVisible(index) ? originalLegendColors[index] : '#eeeeee', height: item === '系列1' ? '1px' : '20px',margin: item === '系列1' ? '10px 0 0 0' : '0px'  }"
                     @click.stop="handleColorClick(index)"></div>
                <!-- 文字(添加颜色状态变化) -->
                <div :style="{ color: isSeriesVisible(index) ?  originalLegendColors[index] : '#eeeeee' }"
                     style="float: left;margin-right: 15px;"
                     @click.stop="handleTextClick(index)">
                  {{ item }}
                </div>
              </div>
            </div>
          </el-col>
        </el-row>
      </div>
      <div style="height:20px;"></div>
    </div>
  </div>
</template>

<script>
import * as echarts from 'echarts'

export default {
  name: 'EChartsLegendInteraction',
  data () {
    return {
      chart: null,
      originalLegendData: ['系列1', '系列2', '系列3', '系列4'],
      selectedLegendData: ['系列1', '系列2', '系列3', '系列4'],
      originalLegendColors: ['#FF5252', '#b0c936', '#26d962', '#267fd9'],
      // 缓存所有系列数据(避免重复生成随机数)
      allSeriesData: [
        [
          58,
          2,
          45,
          97,
          91,
          6
        ],
        [
          53,
          8,
          73,
          85,
          94,
          62
        ],
        [
          78,
          37,
          34,
          87,
          49,
          55
        ],
        [
          53,
          97,
          69,
          10,
          9,
          93
        ]
      ]
    }
  },
  mounted () {
    this.visibleSeries = this.originalLegendData
      .filter(name => this.selectedLegendData.includes(name))
      .map((name, index) => {
        const seriesIndex = this.originalLegendData.indexOf(name);
        return {
          name: name,
          type: name === '系列1' ? 'line' : 'bar',
          data: this.allSeriesData[seriesIndex],
          itemStyle: {
            color: this.originalLegendColors[seriesIndex]
          },
          show: true
        };
      });
    setTimeout(() => {
      this.initChart();
    }, 500);
  },
  methods: {
    initChart () {
      this.chart = echarts.init(this.$refs.chartContainer);
      const option = {
        tooltip: {
          trigger: 'axis',
          axisPointer: {
            type: 'cross',
            crossStyle: {
              color: '#999'
            }
          }
        },
        legend: {
          show: false
        },
        xAxis: {
          type: 'category',
          data: ['1月', '2月', '3月', '4月', '5月', '6月'],
          boundaryGap: true,
          axisLine: {
            lineStyle: {
              color: '#999'
            }
          },
          axisLabel: {
            color: '#666'
          }
        },
        yAxis: {
          type: 'value',
          axisLine: {
            lineStyle: {
              color: '#999'
            }
          },
          splitLine: {
            lineStyle: {
              color: '#eee'
            }
          },
          axisLabel: {
            color: '#666'
          }
        },
        grid: {
          left: '3%',
          right: '4%',
          bottom: '5%',
          containLabel: true
        },
        series: this.visibleSeries
      };
      this.chart.setOption(option);
      window.addEventListener('resize', () => {
        this.chart.resize();
      });
    },
    isSeriesVisible (index) {
      const seriesName = this.originalLegendData[index];
      return this.selectedLegendData.includes(seriesName);
    },
    handleColorClick (index) {
      const seriesName = this.originalLegendData[index];
      // 单选模式:只显示当前系列
      this.selectedLegendData = [seriesName];
      this.updateChartSeries();
    },
    handleTextClick (index) {
      const seriesName = this.originalLegendData[index];
      // 多选模式:切换显示状态
      if (this.selectedLegendData.includes(seriesName)) {
        this.selectedLegendData = this.selectedLegendData.filter(name => name !== seriesName);
      } else {
        this.selectedLegendData.push(seriesName);
      }
      this.updateChartSeries();
    },
    updateChartSeries () {
      // 生成当前可见的系列数据
      this.visibleSeries = this.originalLegendData
        .filter(name => this.selectedLegendData.includes(name))
        .map((name, index) => {
          const seriesIndex = this.originalLegendData.indexOf(name);
          return {
            name: name,
            type: name === '系列1' ? 'line' : 'bar',
            data: this.allSeriesData[seriesIndex],
            itemStyle: {
              color: this.originalLegendColors[seriesIndex]
            },
            show: true
          };
        });
      if (this.$refs.chartContainer) {
        echarts.dispose(this.$refs.chartContainer);
      }
      setTimeout(() => {
        this.initChart()
      }, 500);
    }
  },
}
</script>
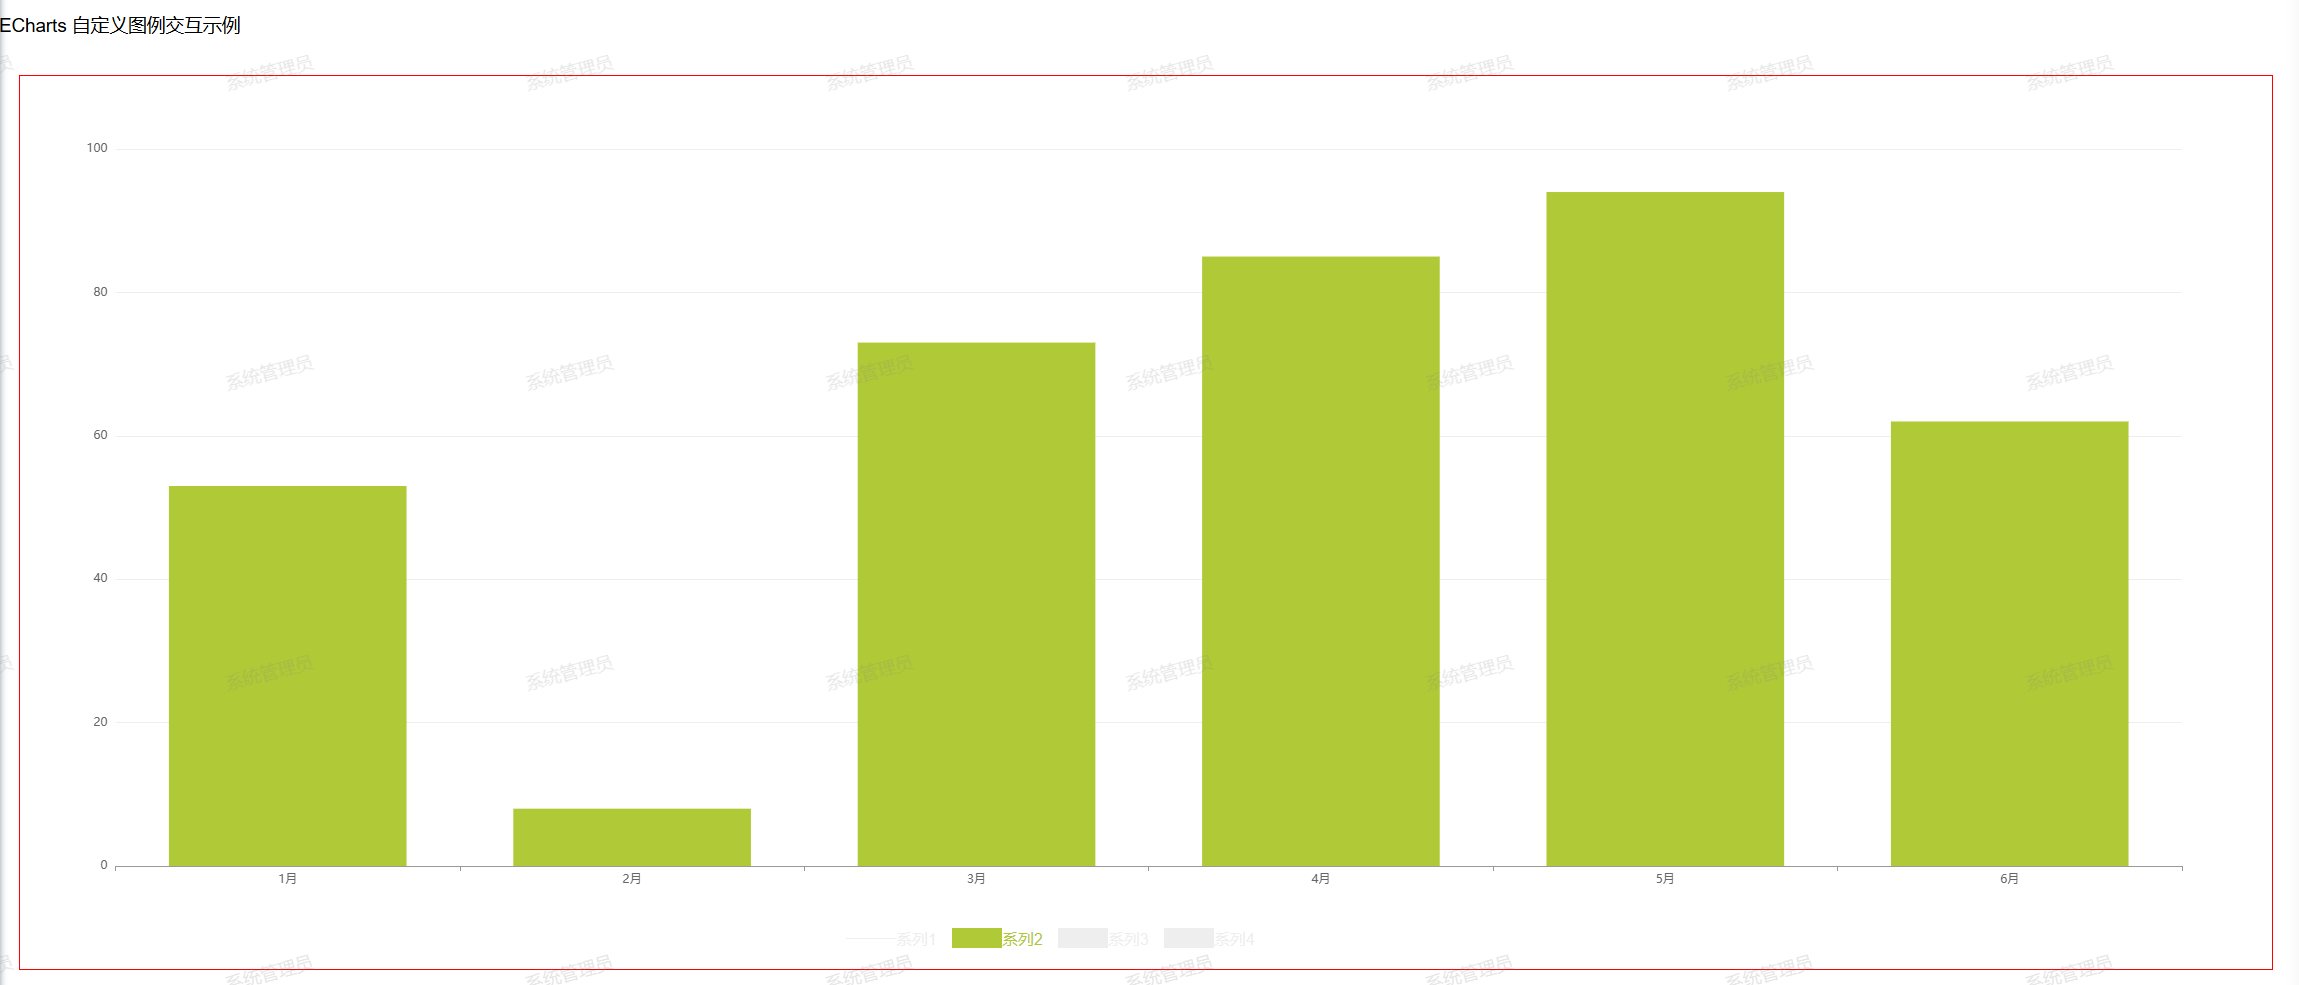
2、示例图
点击图例左边色块是单选,点击图例右边文本是显示隐藏


 3万+
3万+

 被折叠的 条评论
为什么被折叠?
被折叠的 条评论
为什么被折叠?
 到【灌水乐园】发言


