


1、完整代码
<template>
  <div class="echarts-container">
    <h3>ECharts 图例交互示例</h3>
    <div class="control-panel flex flex-wrap gap-2 mb-4">
      <div class="mode-toggle flex gap-2">
        <button @click="switchMode(true)"
                :class="{ 'bg-blue-500': isSingleMode, 'bg-gray-500': !isSingleMode }"
                class="px-4 py-2 rounded-md text-white transition-colors duration-200">
          单选模式
        </button>
        <button @click="switchMode(false)"
                :class="{ 'bg-blue-500': !isSingleMode, 'bg-gray-500': isSingleMode }"
                class="px-4 py-2 rounded-md text-white transition-colors duration-200">
          默认模式
        </button>
      </div>
    </div>
    <div ref="chartContainer"
         id="chartContainer"
         style="height:66vh;margin-top: 1vh;"></div>
  </div>
</template>

<script>
import * as echarts from 'echarts'

export default {
  name: 'EChartsLegendInteraction',
  data () {
    return {
      chart: null,
      isSingleMode: true,
      legendData: ['系列1', '系列2', '系列3', '系列4'],
      xAxisData: ['1月', '2月', '3月', '4月', '5月', '6月']
    };
  },
  mounted () {
    this.initChart();
    this.bindEvents();
  },
  methods: {
    initChart () {
      this.chart = echarts.init(this.$refs.chartContainer);

      const myChart = this.$refs.chartContainer// 通过ref获取到DOM节点
      if (myChart) {
        const thisChart = this.$echarts.init(myChart) // 利用原型调取Echarts的初始化方法
        const option = {
          tooltip: {
            trigger: 'axis',
            axisPointer: {
              type: 'cross',
              crossStyle: {
                color: '#999'
              }
            }
          },
          legend: {
            data: this.legendData,
            selectedMode: this.isSingleMode ? 'single' : 'multiple',
            orient: 'horizontal',
            type: 'scroll',
            bottom: '5%',
            left: 'center',
            pageButtonItemGap: 5,
            pageButtonGap: 10
          },
          xAxis: {
            type: 'category',
            data: this.xAxisData,
            boundaryGap: true,
            axisLine: {
              lineStyle: {
                color: '#999'
              }
            },
            axisLabel: {
              color: '#666'
            }
          },
          yAxis: {
            type: 'value',
            axisLine: {
              lineStyle: {
                color: '#999'
              }
            },
            splitLine: {
              lineStyle: {
                color: '#eee'
              }
            },
            axisLabel: {
              color: '#666'
            }
          },
          grid: {
            left: '3%',
            right: '4%',
            bottom: '15%',
            containLabel: true
          },
          series: this.legendData.map((item, index) => ({
            name: item,
            type: 'bar',
            data: this.generateRandomData(),
            emphasis: {
              focus: 'series'
            },
            itemStyle: {
              borderRadius: [4, 4, 0, 0],
              color: `hsl(${(index * 70) % 360}, 70%, 50%)`
            }
          }))
        };// {}内写需要图表的各种配置,可以在官方案例中修改完毕后复制过来
        thisChart.setOption(option) // 将编写好的配置项挂载到Echarts上
        window.addEventListener('resize', function () {
          thisChart.resize() // 页面大小变化后Echarts也更改大小
        })
      }
    },

    // 绑定事件
    bindEvents () {
      // 图例点击事件
      this.chart.on('legendselectchanged', (obj) => {
        if (this.isSingleMode) {
          // 单选模式:只选中当前点击的图例,其他全部取消选中
          this.legendData.forEach(name => {
            this.chart.dispatchAction({
              type: name === obj.name ? 'legendSelect' : 'legendUnSelect',
              name: name
            });
          });
        }
      });

      // 窗口大小变化时重绘图表
      this.resizeHandler = () => {
        if (this.chart) {
          this.chart.resize();
        }
      };

      window.addEventListener('resize', this.resizeHandler);
    },
    // 生成随机数据
    generateRandomData () {
      return this.xAxisData.map(() => Math.floor(Math.random() * 100));
    },
    // 切换模式
    switchMode (single) {
      this.isSingleMode = single;
      this.updateLegendMode();
    },
    // 更新图例选择模式
    updateLegendMode () {
      if (this.chart) {
        this.chart.setOption({
          legend: {
            selectedMode: this.isSingleMode ? 'single' : 'multiple'
          }
        });
      }
    },
  },
  watch: {
    // 监听模式变化,更新图例选择模式
    isSingleMode () {
      this.updateLegendMode();
    }
  }
};
</script>
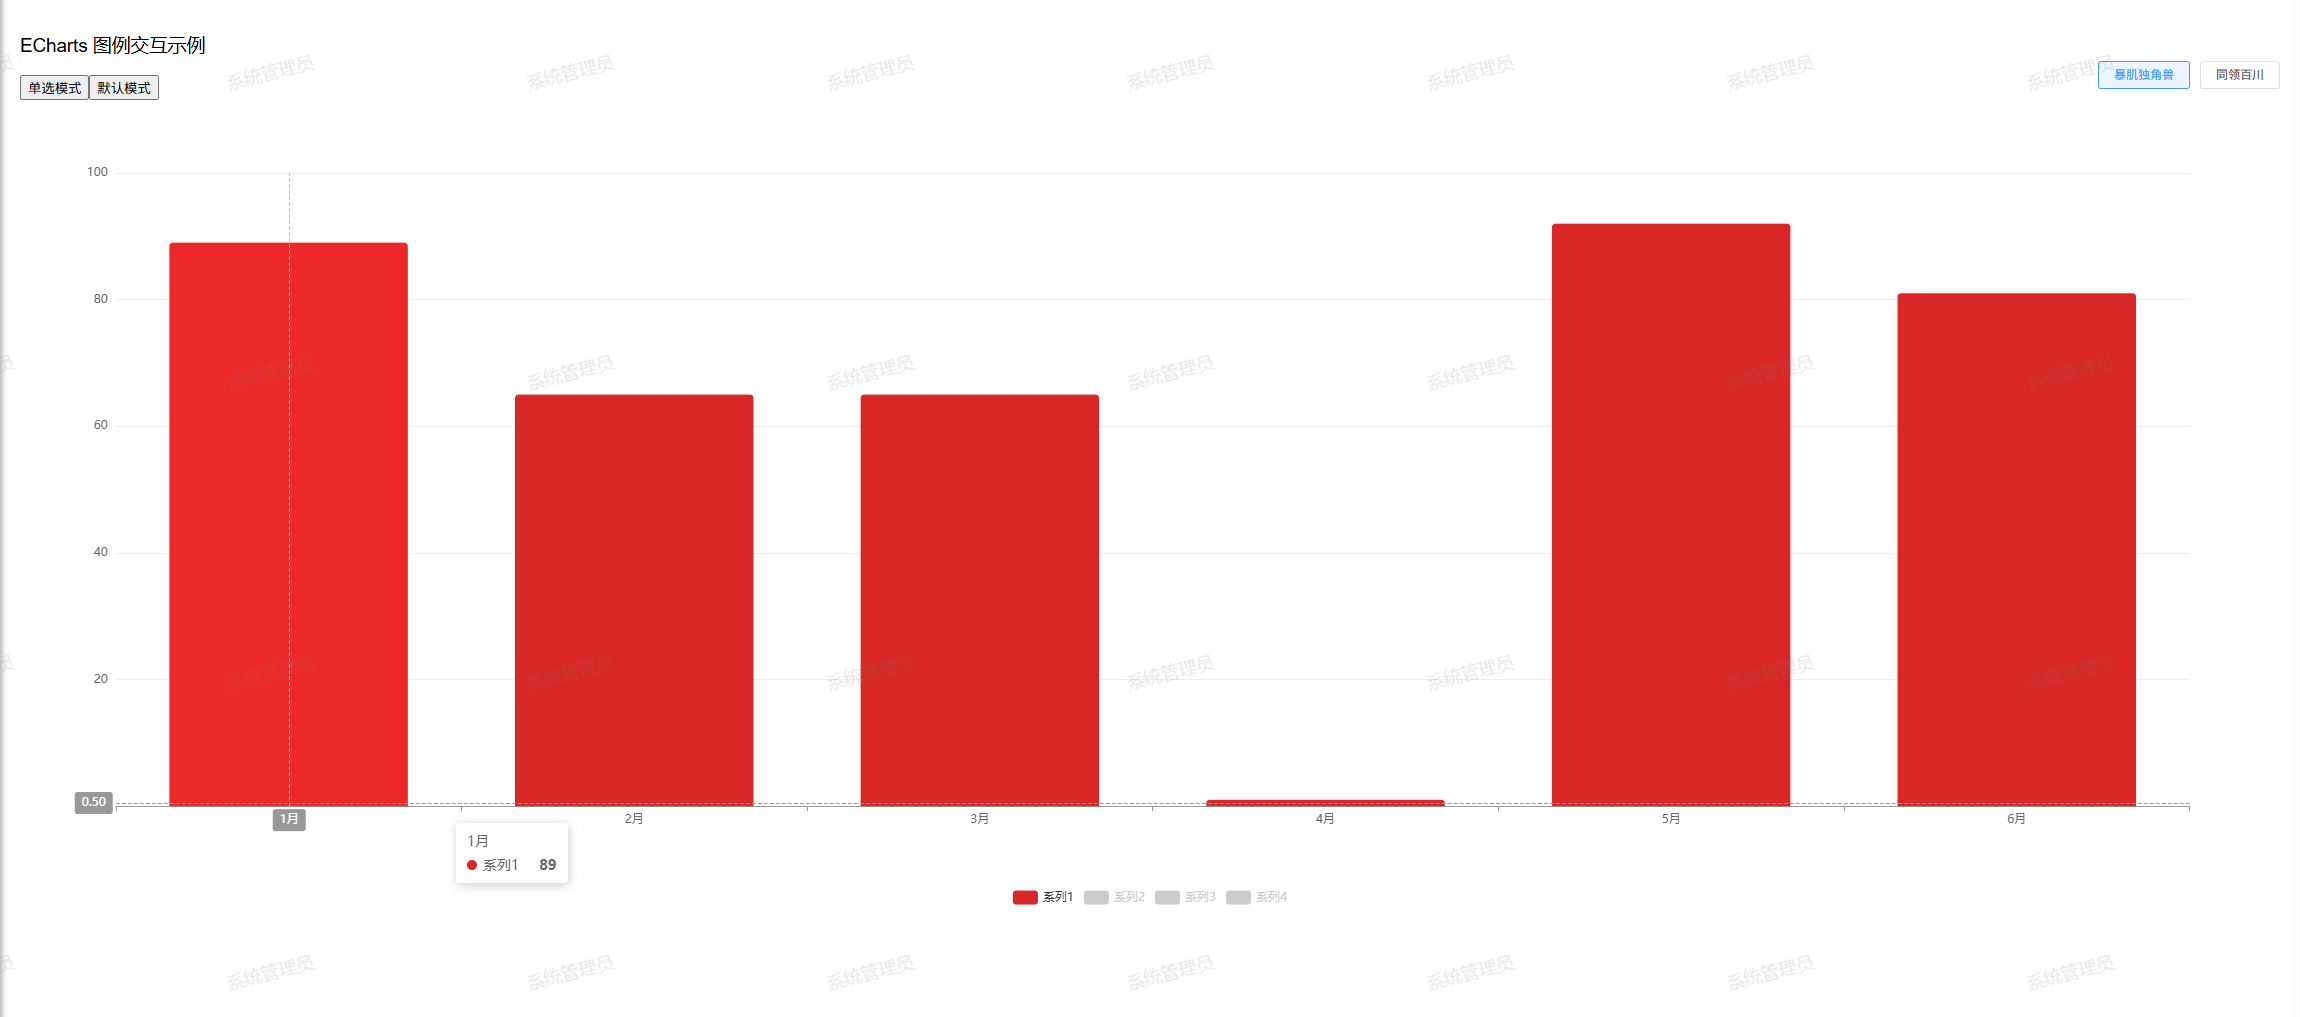
2、示例图


 被折叠的 条评论
为什么被折叠?
被折叠的 条评论
为什么被折叠?
 到【灌水乐园】发言


