


                </div>


            <div class="htmledit_views" id="content_views">
                                        <h1><a name="t0"></a><a></a>Flink metrics简介</h1>
Flink的metrics是Flink公开的一个度量系统,允许收集flink程序的公开指标到外部系统,我们也可以自定义指标通过metric收集,实际开发时经常需要查看当前程序的运行状况,flink 提供了 UI 界面,有比较详细的统计信息。但是 UI 界面也有不完善的地方,比如想要获取 flink 的实时吞吐。本文将详细介绍如何通过metric监控flink程序,自定义监控指标以及metrics在flink的UI界面的应用。
metrics在UI页面上的应用
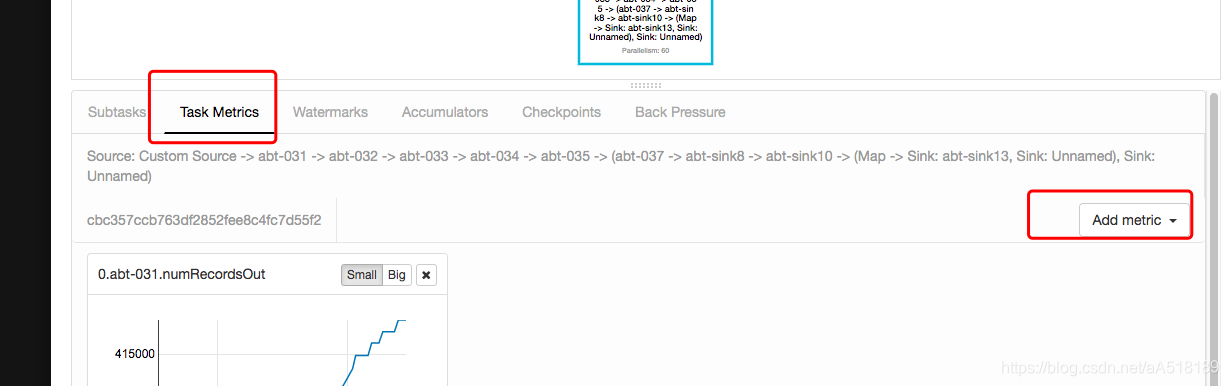
在flink的UI的界面上我们点击任务详情,然后点击Task Metrics会弹出如下的界面,在 add metic按钮上 我们可以添加我需要的监控指标。
注意:如果点击Task Metrics没有显示Add metics 点击一下任务的DAG图就会显示出来,当我们点击了DAG图中某个算子的名字,那么Add metric显示的就是该算子的监控指标,且按照分区显示,算子名前置的数字就是分区号。
各个指标的含义
关于各个指标的含义官网上有详细介绍:https://ci.apache.org/projects/flink/flink-docs-release-1.7/monitoring/metrics.html#availability
自定义监控指标
案例:在map算子内计算输入的总数据
设置MetricGroup为:flink_test_metric
指标变量为:mapDataNub
代码:
- 1
程序启动之后就可以在任务的ui界面上查看
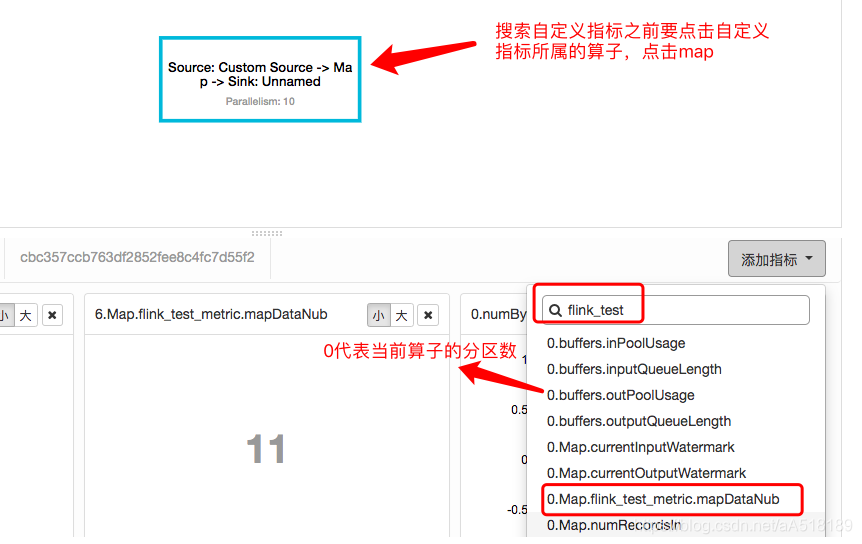
注意点:
1.搜索自定义或者查看某个指标需要点击DAG图中对应算子的名称
2.指标的前缀0,1,2....是指算子的分区数
flink metric监控程序
前面介绍了flink公共的监控指标以及如何自定义监控指标,那么实际开发flink任务我们需要及时知道这些监控指标的数据,去获取程序的健康值以及状态。这时候就需要我们通过 flink REST API ,自己编写监控程序去获取这些指标。很简单,当我们知道每个指标请求的URL,我们便可以编写程序通过http请求获取指标的监控数据。
flink REST API监控程序
为了获取flink任务运行状态和吞吐量我们需要注意一下两点:
- flink集群模式需要知道 JobManager 的地址和端口(5004)
- 对于 flink on yarn 模式来说,则需要知道 RM 代理的 JobManager UI 地址,例如 http://yarn-resource-manager-ui/proxy/application_155316436xxxx_xxxx
1.获取flink任务运行状态(我们可以在浏览器进行测试,输入如下的连接)
http://yarn-resource-manager-ui/proxy/application_155316436xxxx_xxxx/jobs
- 1
返回的结果
-
{
-
jobs: [{
-
id:
"ce793f18efab10127f0626a37ff4b4d4",
-
status:
"RUNNING"
-
}
-
]
-
}
- 1
2.获取 job 详情
需要在/jobs/jobid
http://yarn-resource-manager-ui/proxy/application_155316436xxxx_xxxx/jobs/ce793f18efab10127f0626a37ff4b4d4
- 1
- 2
-
{
-
jid:
"ce793f18efab10127f0626a37ff4b4d4",
-
name:
"Test",
-
isStoppable: false,
-
state:
"RUNNING",
-
start - time:
1551577191874,
-
end - time: -
1,
-
duration:
295120489,
-
now:
1551872312363,
-
。。。。。。
-
此处省略n行
-
。。。。。。
-
}, {
-
id:
"cbc357ccb763df2852fee8c4fc7d55f2",
-
parallelism:
12,
-
operator:
"",
-
operator_strategy:
"",
-
description:
"Source: Custom Source -> Flat Map",
-
optimizer_properties: {}
-
}
-
]
-
}
-
}
- 1
更灵活的方式获取每个指标的请求连接
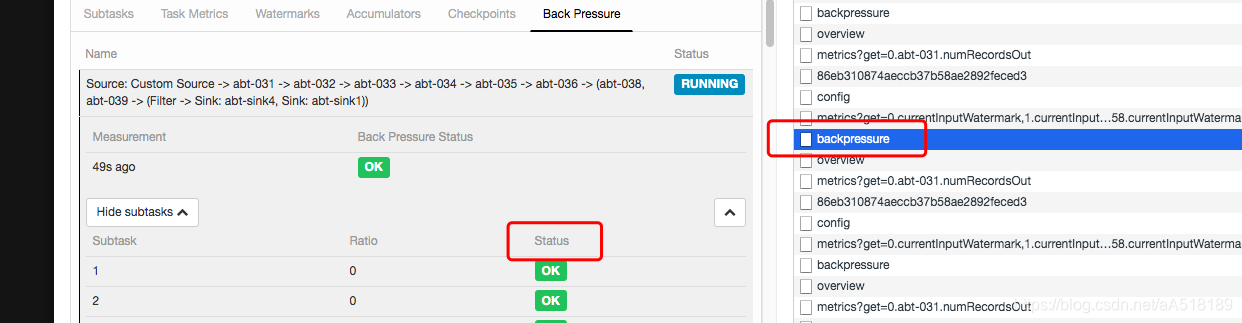
有人可能会问,这么多指标,难道我要把每个指标的请求的URL格式都记住吗?今天教大家一个小技巧,一个前端技术,就是进入flink任务的UI界面,按住F12进入开发者模式,然后我们点击任意一个metric指标,便能立即看到每个指标的请求的URL。比如获取flink任务的背压情况:
如下图我们点击某一个task的status,按一下f12,便看到了backpressue,点开backpressue就是获取任务背压情况的连接如下:
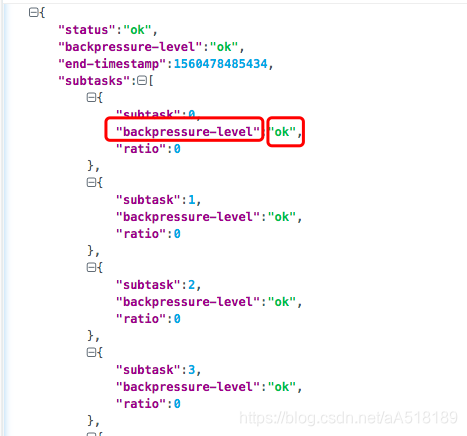
http://127.0.0.1/proxy/application_12423523_133234/jobs/86eb310874aeccb37b58ae2892feced3/vertices/cbc357ccb763df2852fee8c4fc7d55f2/backpressure
- 1
请求连接返回的json字符串如下:我们可以获取每一个分区的背压情况,如果不是OK状态便可以进行任务报警,其他的指标获取监控值都可以这样获取 简单而又便捷。
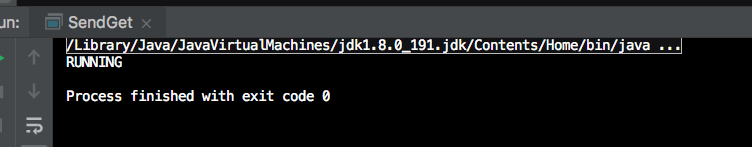
案例:实时获取yarn上flink任务运行状态
我们使用 flink REST API的方式,通过http请求实时获取flink任务状态,不是RUNNING状态则进行电话或邮件报警,达到实时监控的效果。
-
public
class SendGet {
-
public
static
String sendGet(
String url) {
-
String result =
"";
-
BufferedReader
in =
null;
-
try {
-
String urlNameString = url;
-
URL realUrl =
new URL(urlNameString);
-
// 打开和URL之间的连接
-
URLConnection connection = realUrl.openConnection();
-
// 设置通用的请求属性
-
connection.setRequestProperty(
"accept",
"*/*");
-
connection.setRequestProperty(
"connection",
"Keep-Alive");
-
connection.setRequestProperty(
"user-agent",
-
"Mozilla/4.0 (compatible; MSIE 6.0; Windows NT 5.1;SV1)");
-
// 建立实际的连接
-
connection.connect();
-
in =
new BufferedReader(
new InputStreamReader(
-
connection.getInputStream()));
-
String line;
-
while ((line =
in.readLine()) !=
null) {
-
result += line;
-
}
-
}
catch (Exception e) {
-
System.out.println(
"发送GET请求出现异常!" + e);
-
e.printStackTrace();
-
}
-
// 使用finally块来关闭输入流
-
finally {
-
try {
-
if (
in !=
null) {
-
in.close();
-
}
-
}
catch (Exception e2) {
-
e2.printStackTrace();
-
}
-
}
-
return result;
-
}
-
-
public
static
void main(
String[] args) {
-
String s = sendGet(
"http://127.0.0.1:5004/proxy/application_1231435364565_0350/jobs");
-
JSONObject jsonObject =
JSON.parseObject(s);
-
String string = jsonObject.getString(
"jobs");
-
String substring = string.substring(
1, string.length() -
1);
-
JSONObject jsonObject1 = JSONObject.parseObject(substring);
-
String status = jsonObject1.getString(
"status");
-
System.out.println(status);
-
}
-
}
- 1
结果
扫一扫加入大数据技术交流群,了解更多大数据技术,还有免费资料等你哦
扫一扫加入大数据技术交流群,了解更多大数据技术,还有免费资料等你哦
扫一扫加入大数据技术交流群,了解更多大数据技术,还有免费资料等你哦

</div>


 1万+
1万+

 被折叠的 条评论
为什么被折叠?
被折叠的 条评论
为什么被折叠?
 到【灌水乐园】发言


