


 本文介绍了如何使用Python的Matplotlib库和Axes3D模块创建并展示三维点云图,通过生成随机数据并设置坐标轴标签来可视化数据分布。
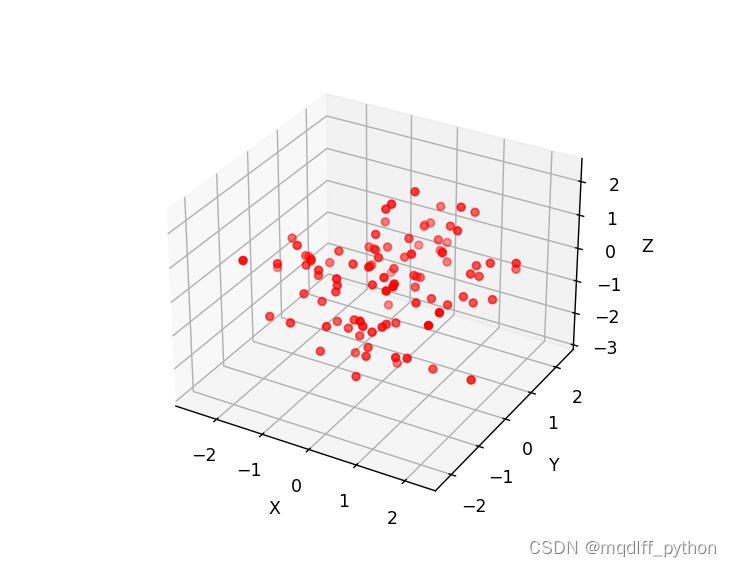
在 Python 中,你可以使用 Matplotlib 库绘制三维点云图。以下是一个简单的示例代码:

import matplotlib.pyplot as plt
from mpl_toolkits.mplot3d import Axes3D
import numpy as np

# 生成随机三维数据
np.random.seed(0)
x = np.random.standard_normal(100)
y = np.random.standard_normal(100)
z = np.random.standard_normal(100)

# 创建一个三维坐标系
fig = plt.figure()
ax = fig.add_subplot(111, projection='3d')

# 绘制三维点云图
ax.scatter(x, y, z, c='r', marker='o')

# 设置坐标轴标签
ax.set_xlabel('X')
ax.set_ylabel('Y')
ax.set_zlabel('Z')

# 显示图形
plt.show()


 1853
1853

 被折叠的 条评论
为什么被折叠?
被折叠的 条评论
为什么被折叠?
 到【灌水乐园】发言


