


import pandas as pd
import matplotlib.pyplot as plt
from pyecharts import Bar, Geo, Map, Pie
df = pd.read_csv("lagou.csv", usecols=['city', 'education', 'salary'])
plt.rcParams['font.sans-serif'] = ['simhei'] # 中文
"""
df['city'].value_counts()[:7].plot(kind='barh') # 绘制条形图
# df['education'].value_counts()[:7].plot(kind='barh') # 绘制条形图
# df['salary'].value_counts()[:7].plot(kind='barh') # 绘制条形图
# df['city'].value_counts()[:7].plot(kind='pie', autopct='%1.2f%%') # 绘制饼图
# df['education'].value_counts()[:7].plot(kind='pie', autopct='%1.2f%%') # 绘制饼图
# df['salary'].value_counts()[:7].plot(kind='pie', autopct='%1.2f%%') # 绘制饼图
plt.show()
"""
"""
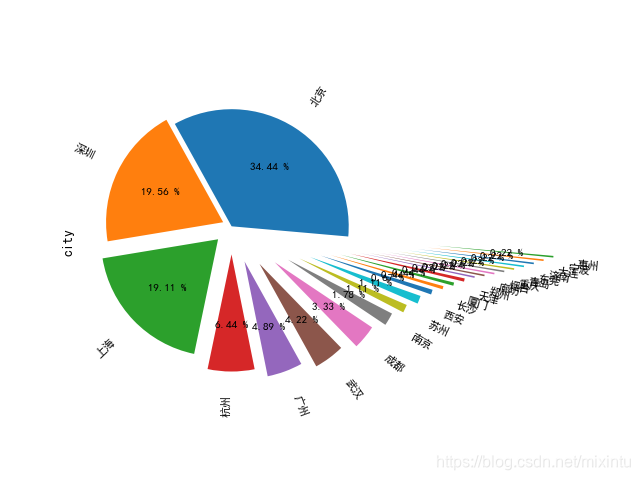
city = df['city'].value_counts()
explode = [x * 0.04 for x in range(len(city))]
city.plot(kind='pie',
explode=explode, # 爆炸
autopct='%3.2f %%', # 百分比显示
pctdistance=0.6, # 百分比距圆心的位置
labeldistance=1.2, # 距圆心的距离
counterclock=True, # 顺时针
radius=0.5, # 半径的大小
startangle=-5, # 自定义第一块饼图和水平面的角度
rotatelabels=True, # 旋转每个label到指定的角度
textprops={'fontsize': 8}
) # 绘制条形图
plt.axis('equal')
plt.show()
"""
"""
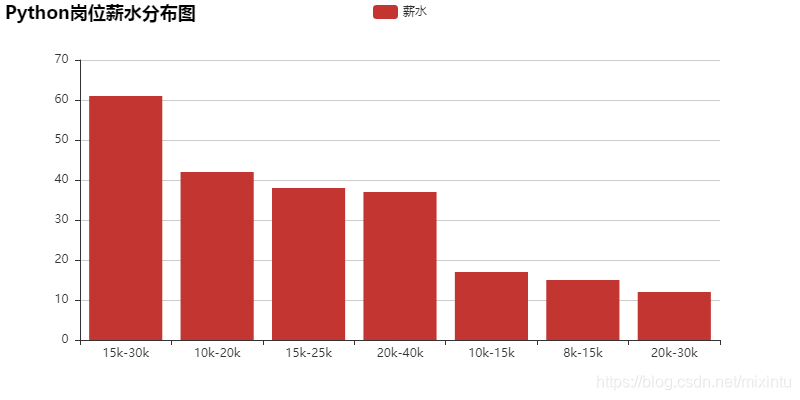
salary = df['salary'].value_counts()[:7]
bar = Bar("Python岗位薪水分布图")
bar.add("薪水", salary.index, salary.values)
bar.render("Python岗位薪水分布图.html")
"""
"""
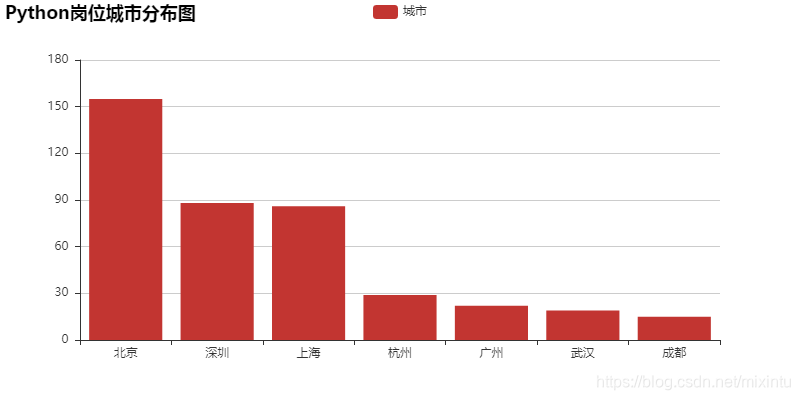
city = df['city'].value_counts()[:7]
bar = Bar("Python岗位城市分布图")
bar.add("城市", city.index, city.values)
bar.render("Python岗位城市分布图.html")
"""
"""
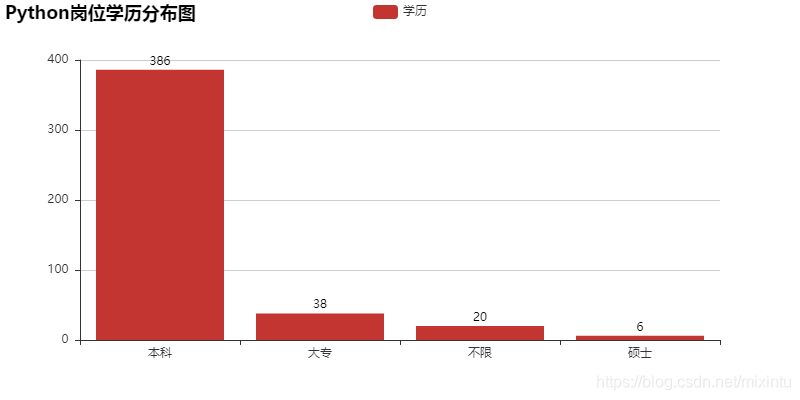
education = df['education'].value_counts()[:7]
bar = Bar("Python岗位学历分布图")
bar.add("学历", education.index, education.values)
bar.render("Python岗位学历分布图.html")
"""


 1403
1403

 被折叠的 条评论
为什么被折叠?
被折叠的 条评论
为什么被折叠?
 到【灌水乐园】发言


