


1. 认识 Jlinks
J-Link 调试探针是优化调试和闪存编程体验的最流行选择。得益于创纪录的闪存加载器、高达 4 MB/s 的 RAM 下载速度以及在 MCU 闪存中设置无限数量断点的能力。J-Link 还支持各种 CPU 和架构。从单个 8051 到大众市场的 Cortex-M,再到 Cortex-A(32 位和 64 位)等高端内核。J-Link 支持直接连接 SPI 闪存,而无需在 J-Link 和 SPI 闪存之间使用 CPU(直接通过 SPI 协议通信)。所有主要 IDE 都支持 J-Link,包括 SEGGER Embedded Studio 或 Visual Studio Code。在此处查看受支持的 IDE 的完整列表、在此处查看受支持设备的完整列表以及在此处查看 SPI 闪存列表。
1.1 关键特性
-
Ultra-fast download speed
-
Unlimited breakpoints in flash memory (Flash Breakpoints)
-
Real-Time Transfer technology for extended debug information
-
All popular devices are supported (Arm, RISC-V, Microchip, Renesas, SiLabs 8051, Cadence)
-
All popular debuggers are supported
-
Includes software and firmware updates
-
Includes use on all target devices currently supported, and on any that will be added
1.2 支持的软件
可供下载的 J-Link 软件和文档包包含大量工具,可简化开发人员的工作并扩展 J-Link 的功能。几乎所有 J-Link 工具都具有多平台支持,可在 Windows、Linux 和 macOS 上运行。
Ozone
Ozone is the debugger for J-Link and J-Trace. It includes all well-known debug controls and information windows and makes use of the best performance of J-Link and J-Trace debug probes.

SystemView
SystemView is a real-time recording and visualization tool for embedded systems, revealing the true runtime behavior of an application. In fact, it even goes far deeper than system insights provided by standard debuggers.

Learn more about SystemView...
1.3 生态系统
广泛的 IDE 支持
J-Link 当然支持 SEGGER 自己的软件,同时还支持大量第三方嵌入式系统开发选项。要了解更多信息,请查看支持的 IDE 和第三方应用程序的概述。
GDB 支持
J-Link 可与基于 GDB 的设置一起使用。GNU 调试器 (GBD) 是 Linux 系统上开发的实际调试器。但是,它现在已经进入嵌入式开发领域(即使目标系统上没有运行 Linux)。GDB 提供了一个标准化的接口/API,可供 IDE 使用。
它还指定了一个标准化协议(GDB 远程协议),允许 GDB 与知道如何处理连接到目标的调试探测器的 GDBServer 进行通信。J-Link 软件和文档包附带 J-Link GDB 服务器,允许在基于 GDB 的设置中使用 J-Link。
Learn more about the J-Link GDB Server...
LLDB 支持
J-Link 可与 LLDB 一起使用。最初,GNU 工具链提供 GCC 作为编译器,GDB 作为调试器。自从 Clang 作为编译器推出以来,LLDB 就被引入(它本质上是 GDB 的后继者)。在协议方面,它向后兼容 GDB,而 IDE 的 API 略有不同。
J-Link 软件和文档包随附 J-Link GDBServer。这允许在基于 LLDB 的设置中使用 J-Link。
OpenOCD 支持
J-Link 可与 OpenOCD(开放式片上调试器)一起使用。OpenOCD 是一种开源软件,可以与任何调试探测器进行接口。它提供了标准化 API,允许 IDE 支持 OpenOCD。互联网上有几个教程描述了如何将 J-Link 与 OpenOCD 一起使用。
请注意:OpenOCD 是第三方软件,因此 SEGGER 无法提供任何保证等。将 J-Link 与 OpenOCD 一起使用会绕过所有 J-Link 特定功能,如闪存编程、无限闪存断点和 J-Link 高调试速度。OpenOCD 将 J-Link 作为一个简单的序列生成器处理,这将影响调试性能。另请注意,将 J-Link 与 OpenOCD 一起使用不在标准 J-Link 支持范围内。OpenOCD 社区提供对 OpenOCD 的支持。
1.4 Jlink型号比较

[1] The hardware features overview always refers to the current hardware version of the appropriate model. Older hardware versions may not support all of the features mentioned here. For a historical overview for older hardware versions, please refer to the SEGGER Wiki.
[2] The download speeds listed here are the peak download speeds that can be achieved by the particular J-Link model. The actual download speed may be lower as it depends on various factors, such as, but not limited to: The selected debug interface and speed, the CPU core and its operating frequency, other devices in the JTAG chain in case JTAG is used as target interface.
[3] Only limited by the bandwidth of the debug interface. Typical sampling frequency of one variable: > 10 kHz.
[4] Max. sampling frequency is guaranteed for sampling one variable and for appropriate target interface speeds being selected (min. 1 MHz). Sampling more than one variable in parallel, may lead to a smaller max. sampling frequency. When this threshold of sampling frequency decrease is hit, depends on different factors (number of variables to be sampled in parallel, size of each variable, selected target interface speed, etc.).
[5] For full trace support, please refer to SEGGER's J-Trace streaming trace probes.
2. 主流调试接口
2.1 JTAG
JTAG (named after the Joint Test Action Group which codified it) is an industry standard for verifying designs of and testing printed circuit boards after manufacture.
JTAG implements standards for on-chip instrumentation in electronic design automation (EDA) as a complementary tool to digital simulation.[1] It specifies the use of a dedicated debug port implementing a serial communications interface for low-overhead access without requiring direct external access to the system address and data buses. The interface connects to an on-chip Test Access Port (TAP) that implements a stateful protocol to access a set of test registers that present chip logic levels and device capabilities of various parts.
电气特性

The connector pins are:
-
TDI (Test Data In) 数据输入
-
TDO (Test Data Out) 数据输出
-
TCK (Test Clock) 测试用的时钟线
-
TMS (Test Mode Select) 测试模式选择
-
TRST (Test Reset) optional. 测试复位
精简引脚数量的 JTAG (IEEE 1149.7)
Reduced pin count JTAG uses only two wires, a clock wire and a data wire. This is defined as part of the IEEE 1149.7 standard.[8] The connector pins are:
-
TMSC (Test Serial Data)
-
TCK (Test Clock)
It is called cJTAG for compact JTAG.
The two wire interface reduced pressure on the number of pins, and devices can be connected in a star topology.[9] The star topology enables some parts of the system to be powered down, while others can still be accessed over JTAG; a daisy chain requires all JTAG interfaces to be powered. Other two-wire interfaces exist, such as Serial Wire Debug.

Example of JTAG with reduced pin count
常用的扩展
[编辑]
关于制造商的扩展:英飞凌,MIPS EJTAG,飞思卡尔COP, ARM ETM (Extended Trace Macrocell), OnCE etc.
广泛的应用
[编辑]
客户端软件
[编辑]
可以通过使用一些支持JTAG的应用程序来访问JTAG接口。
2.2 SWD 与 SWO
SWD
ARM's Serial Wire Debug (SWD) replaces the traditional 5-pin JTAG debug interface by introducing a 2-pin interface with a clock (SWDCLK) and a single bi-directional data pin (SWDIO), providing all the normal JTAG debug and test functionality, anyhow dayisy-chaining devices as via JTAG is not possible. SWDIO and SWCLK are overlaid on the TMS and TCK pins, allowing to use the same connector for JTAG and SWD. In order to communicate with a device via SWD, data is send on SWDIO, synchronous to the SWCLK. With every rising edge of SWCLK, one bit of data is transmitted or received on the SWDIO pin.
| Pin | Type | Explanation |
|---|---|---|
| SWCLK | Input | Clock signal to target CPU. It is recommended that this pin is pulled to a defined state of the target board. Shared with TMS on targets which support JTAG and SWD. |
| SWDIO | I/O | Bi-directional data pin. This pin should be pulled up on the target. Shared with TMS on targets which support JTAG and SWD. |
| SWO | Output (optional) | Serial wire output, allowing the CPU to output custom data like printf output, asynchronous to SWCLK and other debug pins. Usually shared with the TDO pin on devices which support JTAG and SWD. Not available on all devices which support SWD. |
SWO
In addition to the debug signals, ARM's SWD interface also specifies a dedicated pin which allows the target CPU to output specific data like printf output on a dedicates pin via UART or Manchester protocol. This pin is unidirectional, so it is not possible to send data to the target CPU on this pin. Note that not all ARM architectures that support SWD, also support SWO. For more information, please refer to SWO
Jump to navigationJump to search
When introducing the SWD interface, ARM also introduced an optional extension for SWD, called Serial Wire Output (SWO). SWO specifies a dedicated pin, in addition to the debug signals of the SWD interface, which allows the target CPU to output specific data like printf output on a dedicated pin via UART or Manchester protocol. This pin is unidirectional, so it is not possible to send data to the target CPU on this pin.
The Instrumentation Trace Macrocell (ITM) and Serial Wire Output (SWO) can be used to form a Serial Wire Viewer (SWV). The Serial Wire Viewer provides a low cost method of obtaining information from inside the MCU.
Note:
-
Not all targets that support SWD also support SWO. Moreover, SWO is not supported by all CPU architectures that support SWD.
-
Currently, J-Link / J-Trace (software) only supports the UART protocol. Manchester encoding is currently not supported.
SWO clocking
The SWO pin is connected to the Trace Port Interface Unit (TPIU). This needs to be clocked so the SWO pin can output data. On most Cortex-M target devices this clock is derived 1/1 from the CPU core clock. Most SWO software tools that display the data stream will ask for an SWO or CPU clock in the configuration settings. Here the SWO clock needs to be entered that will be set after the system initialization is finished (usually this is the case at the point where you application jumps to main). As mentioned before in most cases this is simply the CPU core clock.
2.3 J-Link Virtual COM Port
所谓虚拟串口,就是传统老旧电脑上的物理串口已经被消费者领域电脑给取消了。但是嵌入式开发需要,因此,使用了用 USB 转串口协议芯片 ,通过USB口连接电脑,模拟实际的串口,效果一模一样。
Virtual COM port (VCOM) is a technology used to replace the traditional COM ports on modern PCs and laptops. From the hosts perspective, there is no difference between a "real", physical COM port and a virtual COM port. The virtual COM port presents itself in the same way and offers the same functionality. The virtual COM port is a COM port via USB. In case of the J-Link, if the virtual COM port is enabled, J-Link presents itself as a composite device with multiple interfaces: The J-Link functionality (One bulk in, one bulk output) and the COM Port interface. Both can be used simulteously.
USB to Virtual COM Port adapters
Most modern PCs and notebooks no longer provide COM connectors on their mainboards due to the large size factor of the COM port connector and the fact that very few consumer users have any use for them. The typical replacement is a a USB device to show up as a COM port at the PC. These USB to COM adapters that have a USB connector on one side and a COM connector on the other one allow retrofitting a modern machine with a COM port. Once the adapter has been connected to the PC, a new COM port will show up which can then be used as a normal COM port by terminal applications etc.
Identifying Virtual COM Ports on a windows machine
Device Manager before VCOM device has been connected:

Device Manager after VCOM device has been connected:

VCOM on J-Link
The SEGGER J-Link as well as most J-Link OBs support VCOM as an additional feature to avoid the need to expose an additional COM port or additional USB connector on the target board. The Tx and Rx pins of the target UART are connected to the J-Link or J-Link OB which will forward this data via the VCOM functionality over USB to the PC the J-Link is connected to. So a J-Link in this case is a multi-interface USB device. One interface exposing the VCOM port that may be used by any terminal application etc. to get terminal data from the target device and one exposing the J-Link USB interface that is used by IDEs etc. to debug the target device. Some J-Link OBs offer up to 3 VCOMs.
3. 软件支持
3.1 J-Link GDB Server
The remote server for GDB
The J-Link GDB Server is a remote server for the GDB which allows to use J-Link with GDB or any toolchain which uses GDB as debugging interface, such as Yagarto and Sourcery G++.
The GDB and GDB Server communicate via a TCP/IP connection, using the standard GDB remote serial protocol.
Overview
The GDB supports a standard set of commands like open elf/bin files, reading/writing memory, etc. Beside this, the GDB also supports so called monitor commands which are passed to the GDB Server and interpreted by it, allowing it to implement J-Link specific commands like reading/writing CP15 registers, enabling flash download via J-Link, using Unlimited Flash Breakpoints, enabling semihosting, etc.
Licensing
The J-Link GDB Server is part of the J-Link Software and Documentation Package and is available in a GUI or command-line version. The software package is free for any J-Link or J-Trace device and can be downloaded here:
GNU Project Debugger (GDB) Overview
The GNU Project Debugger (GDB) is a freely available debugger, distributed under the terms of the GNU Public license (GPL). It connects to an emulator via a TCP/IP connection. It can connect to every emulator for which a GDB server software is available. The latest Unix version of the GDB is freely available from the GNU committee under: http://www.gnu.org/software/gdb/download/
Availability: J-Link GDB Server comes with multi-platform support and is available for Windows, Linux and macOS.
Requirements: To use the J-Link GDB Server, you have to meet the following requirements:
-
Target hardware with supported CPU
Protocol Extensions:
-
SWO support
GDB Server supports transfer of SWO data (terminal output, instrumentation trace, PC samples, etc.)
3.2 Ozone
调试器和性能分析器
Ozone 是适用于 J-Link 和 J-Trace 的多平台调试器和性能分析器。

概述 Ozone 是一款功能齐全的嵌入式应用程序图形调试器。使用 Ozone,可以在 C/C++/Rust 源代码和汇编级别调试任何嵌入式应用程序。Ozone 可以加载使用任何工具链/IDE 构建的应用程序,也可以在没有任何源代码的情况下调试目标的驻留应用程序。Ozone 包含所有众所周知的调试控件和信息窗口,并利用 J-Link 和 J-Trace 调试探针的最佳性能。用户界面设计直观,完全可配置。所有窗口都可以移动、调整大小和停靠,以满足任何开发人员的需求。
Ozone 不仅仅是一个简单的调试器。它的各种功能(包括跟踪、代码分析和代码覆盖率分析)使其成为一个强大的性能分析器,使您能够获得完整的系统洞察力,追踪效率低下和错误,并使您的产品更加出色。

关键特性
-
Stand-alone graphical debugger
-
Debug output of any toolchain and IDE
-
Rust support
-
C/C++/Rust source level debugging and assembly instruction debugging
-
Debug information windows for any purpose: disassembly, memory, globals and locals, (live) watches, CPU and peripheral registers
-
Source editor to fix bugs immediately
-
High-speed programming of the application into the target
-
Direct use of J-Link built-in features (Unlimited Flash Breakpoints, Flash Download, Real Time Terminal, Instruction Trace)
-
Scriptable project files to set up everything automatically
-
New project wizard to ease the basic configuration of new projects
一站式解决方案
Ozone supports Arm-based and RISC-V microprocessors. With J-Link tightly integrated, all devices supported by J-Link can be used with Ozone.
Ozone is multi-platform for Windows, macOS, and Linux. Similar look and feel on all platforms and fully portable projects enable efficient development on the operating system of your choice.
支持的构建工具链
Ozone can be used with any toolchain that generates Elf/Dwarf debug information for its output. The list of tested toolchains and IDEs includes Embedded Studio, and other GCC and GCC-based IDEs, clang/LLVM and Arm Compiler.
Toolchain not listed? Please don’t hesitate to contact us.
独立调试器
Ozone 专注于调试。没有编译器或项目窗口来分散您的工作注意力,所有调试窗口都可以移动、调整大小和停靠,为您提供所需的工作空间。
Ozone 提供所有众所周知的调试控件和信息窗口等。指令跟踪、功率图、实时监视和实时终端 I/O 进一步扩展了这些功能。
使用源代码编辑器,您可以在检测到错误时立即修复错误。

性能分析器
Ozone 的功能远不止简单的调试。借助 J-Link 和 J-Trace 的广泛功能,它可用于对目标系统进行全面的性能分析。
与 J-Trace 结合使用,Ozone 可以记录和分析应用程序的运行时行为。您可以回顾已执行的指令,查看系统最后执行的操作,并在时间轴中可视化函数和中断调用路径。此外,还会分析执行情况,以提供完整的代码覆盖率和性能分析。
借助 J-Link 的高速采样技术,Ozone 允许您随时间采样和可视化系统变量,并在目标保持运行的同时轻松检查调试器中的值和标志。
J-Link 的功率测量功能使您能够在调试会话中记录目标设备的功耗。当您开发低功耗设备并需要了解启用或禁用某些组件时功耗如何变化时,这尤其有用。
所有性能分析窗口都可以同步以获取它们之间的链接。想知道为什么设置了错误标志?检查数据图和指令跟踪窗口。想看看打开显示器时会发生什么?查看时间线和功率图。

洞察系统运行内部细节
除了分析运行时性能外,Ozone 还提供有关系统停止时状态的详细信息。
凭借其 RTOS 感知功能,Ozone 可为您提供有关应用程序操作系统的信息:系统在哪个任务中停止?其他任务当前正在执行什么?每个任务使用了多少堆栈?
Ozone 附带用于 embOS 和 FreeRTOS 的 RTOS 感知插件。您可以使用插件 SDK 为您的操作系统添加感知功能。

自动化您的设置和测试
Ozone 项目采用类似 C 的脚本语言,允许您配置图形用户界面并自动化调试工作流程。大多数可通过 GUI 访问的操作都具有附属脚本函数,可从项目脚本或手动从调试器控制台窗口调用。
在项目文件中,您可以使用各种事件处理程序对某些事件执行操作,例如调试启动时、下载前、重置后或暂停和运行时。您还可以将事件处理程序添加到断点。使用此功能,您可以配置一致、全面的验证和调试设置。这使得自动化测试无需用户交互即可轻松运行。
使用许可
商业用途-收费
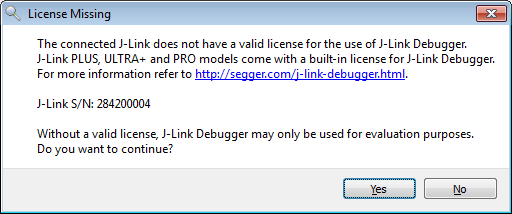
Ozone can be used in a commercial environment as part of the licence for J-Link PLUS, ULTRA+, PRO and J-Trace. With J-Link BASE, Ozone can be used commercially after purchasing the J-Link BASE to PLUS upgrade bundle, that includes the Ozone license. With other J-Link models, Ozone remains in evaluation mode and presents the following screen each time a debug session is started:
非商业用途-免费
Like most of our software, Ozone can easily be downloaded and installed without any registration process. For non-commercial use or evaluation, Ozone is available to be used free of charge. With a J-Link PLUS, PRO, ULTRA+, or with a J-Trace, Ozone is available for free.

下载与安装
Download the setup and install Ozone with a few clicks. Multiple versions of Ozone can be installed on the same PC without any problems, as they can co-exist in different directories. Application settings are shared across the versions.
More on how to get started with Ozone...
3.3 J-Link RDI
J-Link-RDI software is an RDI interface for J-Link. It makes it possible to use J-Link with any RDI compliant debugger. The package consists of 2 DLLs, which need to be copied to the same folder. In order to use these DLLs, they need to be selected in the debugger.
Overview
J-Link RDI is a real-time debug interface that allows any RDI-compliant debugging tools and integrated development environments (IDEs) to communicate with J-Link or J-Trace devices. It provides an abstraction layer that allows developers to use standard debugging commands and protocols.
With J-Link RDI, developers can also access advanced debugging features such as flash programming, real-time code execution control, and access to on-chip debugging resources. This enables efficient debugging and testing of embedded software during development, helping to identify and resolve issues quickly.
Unlimited Flash Breakpoints
The RDI DLL allows setting software breakpoints in flash memory areas, in the following called flash breakpoints. This makes it possible to set an unlimited number of flash breakpoints, rather than just the 2 hardware breakpoints permitted by the ICE. Setting flash breakpoints is executed very fast using a RAMcode specially designed for this purpose; on chips with fast flash the difference between breakpoints in RAM and Flash is unnoticeable. More information about Unlimited Flash Breakpoints

3.4 J-Link RTT
J-Link RTT Viewer is a GUI application to use all features of RTT in one application. Available for Windows, macOS and Linux, it is included in the J-Link Software and Documentation package. It is free with any model J-Link or J-Trace.
Overview
J-Link RTT Viewer 是使用调试主机(Windows、macOS 和 Linux)上 RTT 的所有功能的主要 GUI 应用程序。RTT Viewer 可以独立使用,打开与 J-Link 和目标的独立连接,也可以与正在运行的调试会话并行使用,连接到它并使用此现有 J-Link 连接。
For a complete documentation of J-Link RTT Viewer refer to the J-Link User Manual (UM08001), Chapter RTT.
版权类型
免费
使用方式
J-Link RTT Viewer + 引入调试代码库到源码项目中。源码在 RTT 目录:
C:\Program Files (x86)\SEGGER\JLink\Samples\RTT\SEGGER_RTT_V694.zip
本人已使用,terminal0 输出调式信息,适配过程很方便。解压就是源代码和例程。
3.5 SystemView
The real-time software analysis tool from SEGGER. SystemView records the runtime behavior of an embedded system for in-depth analysis and visualization.

概述
SystemView 是一款用于嵌入式系统的实时记录和可视化工具。它揭示了应用程序的真实运行时行为,比调试器提供的系统洞察更深入。这在开发和使用包含多个线程和中断的复杂嵌入式系统时尤其有效。SystemView 可以确保系统按设计运行,追踪效率低下的情况,并发现意外的交互和资源冲突。

关键特性
-
Continuous real-time recording of an embedded system
-
Capture tasks, interrupts, timers, resources, API calls, and user events
-
Recording via J-Link and SEGGER RTT Technology, IP, or UART
-
Live analysis and visualization of captured data
-
Minimally system intrusive
-
Works on any CPU
-
Works with any RTOS and with bare-metal systems
-
SEGGER embOS, emNet, and emFile API call tracing as standard
-
uC/OS-III, Micrium OS Kernel, FreeRTOS, NuttX and Zephyr instrumentation included
-
Free for non-commercial use without limitation
Supported RTOS
Currently embOS, uC/OS-III, Micrium OS Kernel, FreeRTOS, NuttX and Zephyr can be used with SystemView out-of-the-box.
Recording events
在目标系统上,SystemView 记录运行时发生的事件。这些事件可以是中断、计时器、任务切换和使用 RTOS 的调度、API 函数调用和返回,也可以是用户事件和消息。在目标继续运行的同时,SystemView 应用程序中会检索、分析和可视化这些事件。SystemView 中的事件窗口会显示记录的事件以及更多信息。
为了在目标系统上保持较低的通信开销,SystemView 仅记录基本信息。
SystemView 分析事件中的所有信息并显示:
API 函数名称及其参数和值 调用发生时的记录时间或系统时间 调用发生的任务 API 调用的持续时间 示例输出:“已使用参数值 y 和 z 调用 ID 为 x 的 API 函数,并在上一个事件发生后 n 个刻度调用该函数”。
常规事件长度为 4 到 8 个字节,在 200 MHz 下记录大约需要 1 µs。在每秒 10,000 个事件的情况下,SystemView 添加的开销不到 CPU 时间的 1%,数据量很容易在记录器的带宽限制内。
事件的时间戳可以精确到 1 个 CPU 周期,这相当于 200 MHz CPU 上的 5 ns。


Event Timeline window
Most embedded systems do not have linear code execution. They implement interrupts for timers and use of peripherals, or might use an RTOS with multiple tasks.
The target generates events on enter and leave of interrupts, when tasks become ready for execution, and when a task starts or stops execution. The SystemView Application plots these events in the Timeline window and shows the context in which they happen.
This enables easy analysis of when, how long, and why tasks run or what happens on an interrupt.
This helps identify issues and inefficiencies, such as:
-
Incorrect task priorities or priority inversion leading to starvation
-
Incorrect inter-task communication
-
Inefficient delays and timeouts
-
Questionable or unnecessary interrupts

DataPlot window
SystemView's data recording features provide deeper insight into system behavior. Recorded data includes variables, sensor data, states or any other custom data. All recorded data is directly synchronized with events and anything else recorded with SystemView. To view the data, the DataPlot window provides a scope-like visualization that is consistent with SystemView's Timeline and CPU load windows.
With the ability to monitor variable data alongside runtime events, developers can easily identify and analyze system behavior, pinpoint anomalies, and optimize performance. The DataPlot window supports high sampling rates, offers customizable visualization options, and allows decoding of multiple variables in different formats for precise and detailed analysis.
More about the DataPlot window...

Visualization of recorded data in SystemView's DataPlot window
Context Statistics window
SystemView allows users to identify blocking reasons. The Context Statistics window presents detailed information on a task’s total active time, blocked time, and suspended time. Additionally, the blocked time is categorized into segments such as blocks caused by interrupts, other tasks, or the scheduler, and it shows the specific task or interrupt responsible for the block.
Users can select the task they wish to analyze via a drop-down menu. In addition, the ‘Hide when empty’ checkbox allows for a clear overview, showing only events that have actually occurred.
Optimizing the performance of tasks
CPU cycles are limited on embedded systems, making it important to optimize the performance of tasks as well as to get the order of execution and the time distribution right.
With the CPU Load Window, SystemView helps analyze where CPU load is high. By knowing what happens at or before high-load times, the system can be tuned to avoid bottlenecks which may lead to delayed execution of important tasks.
The Runtime Window provides additional information about the runtime distribution of contexts. It can be used to verify that each context runs within its timing limits or to find cases where a context unexpectedly runs too long.


跟踪和分析性能
SystemView sets up events especially suited to mark certain points in a target system. To easily measure the duration from point A to point B, or from point A through B to point C, marker start, mark, and marker stop events can be generated. The SystemView application automatically links corresponding markers and adds more information, such as run time and run count of the measurement.

日志输出
SystemView includes logging of messages with a recording. Simple strings can be recorded as a log, warning, or error message. The logging functions support formatting of strings, similar to printf(). Since formatting strings can be time-consuming and requires additional memory, this can be deferred to the SystemView Application. The target system simply records the format string and the parameters in an event. Then the SystemView Application takes care of formatting the string and prints it in the Terminal Window.

堆区监控
SystemView monitors heap memory allocation. In many cases, memory can be allocated for the lifetime of the application without a problem. A problem occurs when the peak load of the heap increases over time, i.e. the application is consistently increasing the amount of memory it uses. This means the application is leaking memory and will eventually run into trouble. With SystemView’s heap memory monitoring it is easy to see where memory allocations are made, providing clues to where the leak may be.

版权
SystemView is available as a SEGGER Software Tool under SEGGER's Friendly License for non-commercial use and SEGGER's Commercial-use License. Licenses for SystemView are perpetual for as long as you want to use it. No annual subscription is required.
*Discount applies to second license and all additional licenses of the Commercial-use License.
More about SystemView licensing...
3.6 JScope
实时数据可视化。J-Scope 是一种在目标开发板运行时,可实时分析和可视化微控制器上的数据的软件。
介绍
它不需要 SWO 之类的功能或目标上的任何额外引脚,仅仅使用现有的标准调试端口。
J-Scope 可以以示波器式风格显示多个变量的值。它读取 elf 文件并允许选择多个变量进行可视化。您只需将目标微控制器连接到 J-Link,刷新应用程序并启动 J-Scope。
只需几个步骤,您就可以配置 J-Scope,并选择要显示的符号。配置可以存储在项目文件中,以便于重复使用和移植。
J-Scope 中选择的每个符号都可以单独配置。上下移动图形以更改零基线或更改其分辨率。选择是否在图形中可视化符号或仅在观察面板中显示其值。
分析收集的数据,滚动可视化图形,放大和缩小或将数据保存到文件中以供进一步分析。
J-Scope 可以与您的调试环境并行使用,并扩展您的 IDE 调试体验。
使用方法
-
双击可执行文件启动 J-Scope。
-
在配置对话框中,选择您的 elf 文件。对于大多数目标,无需指定配置。如果有任何问题,请选择您的目标设备并相应地配置接口。
-
单击“确定”。符号选择对话框打开。
-
选择您要观察和分析的应用程序符号。单击“确定”启动 J-Scope。
可以通过工具栏中的记录按钮(红点)启动数据采样。elf 文件和选定符号的配置可以保存到 J-Scope 项目中,以便轻松重复使用。可以通过菜单打开 J-Scope 项目,也可以直接将其拖放到可执行文件中。
有关如何使用 J-Scope 的更多信息,请参阅 SEGGER Wiki。

数据采集方法
J-Scope 提供两种数据采集技术:
-
SEGGER 高速采样 (HSS)。
-
SEGGER 实时传输 (RTT)。
这两种模式都不需要在目标上安装额外的硬件,例如在 Cortex-M 目标上提供 SWO 引脚,一切都通过调试目标时用于调试通信的正常调试信号完成。两种采集方法都要求目标支持后台内存访问,这意味着 J-Link 可以在应用程序运行时访问目标系统的内存,而无需停止 CPU。有关支持后台内存访问的目标 CPU 列表,请参阅本页下方。这允许对数据进行非侵入式分析,而不会破坏目标应用程序的任何实时行为。为了获得最佳结果和体验,建议使用 J-Link PRO / ULTRA+。
通过 RTT 进行数据采集
使用此技术时,目标应用程序执行数据采样并将结果存储在驻留在目标内存中的 RTT 缓冲区中。J-Link 定期从 RTT 缓冲区读取数据并将其传输到 J-Scope 应用程序。下面解释了此技术的优缺点。
优点:
-
允许比 HSS 高得多的数据吞吐量。最高可实现 2 MB/s。即使目标上的缓冲区只有 512 字节,也可以实现最高 1 MB/s
-
数据采集与目标应用程序执行同步,因为应用程序决定何时采样什么数据
-
J-Scope 不需要知道变量的位置。连接时,J-Scope 会自动检测 RTT 缓冲区的位置。
-
可以将时间戳等添加到数据样本中,从而允许将上下文中获取的数据设置为目标应用程序执行状态
-
无需额外的硬件(例如 Cortex-M 上用于 SWO 的额外引脚)
缺点:
-
需要对目标应用程序进行检测以提供缓冲区并在需要时将采样数据存储到其中
-
需要小型 RTT 缓冲区
通过 HSS 进行数据采集
使用此技术时,J-Link 会在后台以固定间隔定期从目标上的指定地址读取数据,并将数据传输到 J-Scope 应用程序。下面将解释此技术的优缺点。
优点:
-
不需要对目标应用程序进行任何检测。J-Scope 只需连接到现有应用程序并开始采样
-
不需要额外的硬件(例如 Cortex-M 上用于 SWO 的额外引脚)
缺点:
-
与 RTT 方法相比,采样频率和最大数据吞吐量相对较低。
-
最大采样频率在很大程度上取决于 J-Link 型号和采样的变量数量。有关监视 1 个变量的最大采样频率列表,请参阅“支持的目标”选项卡
-
数据采集以固定间隔进行,并且与应用程序执行异步,因此无法将获取的数据同步到应用程序执行状态
Model comparison
| J-Link Model | Max. no. of variables | Max. sampling frequency |
|---|---|---|
| J-Link PRO (V4 or later) | 100 | Unlimited |
| J-Link ULTRA+ (V4 or later) | 100 | Unlimited |
| Other models | 10 | 1 kHz |
3.7 J-Link - Web control panel


 3771
3771

 被折叠的 条评论
为什么被折叠?
被折叠的 条评论
为什么被折叠?
 到【灌水乐园】发言


