 Prometheus+Grafana监控体系及Spring Boot集成


前序:在windows已经按照如下教程安装好了prometheus和grafana以及redis_exporter和windows_exporter
现记录如何在自己的笔记本启动
- 启动D:\Develop\prometheus-community\prometheus-2.41.0.windows-amd64下的prometheus.exe,直接双击就可以,访问http://127.0.0.1:9090/targets
- 启动D:\Develop\prometheus-community\grafana-8.2.2\bin下的grafana-server.exe,访问http://127.0.0.1:3000,用户名和密码都是admin
- 启动redisD:\Develop\Redis\redis-6.2.6-x64-windows,双击redis-server.exe。
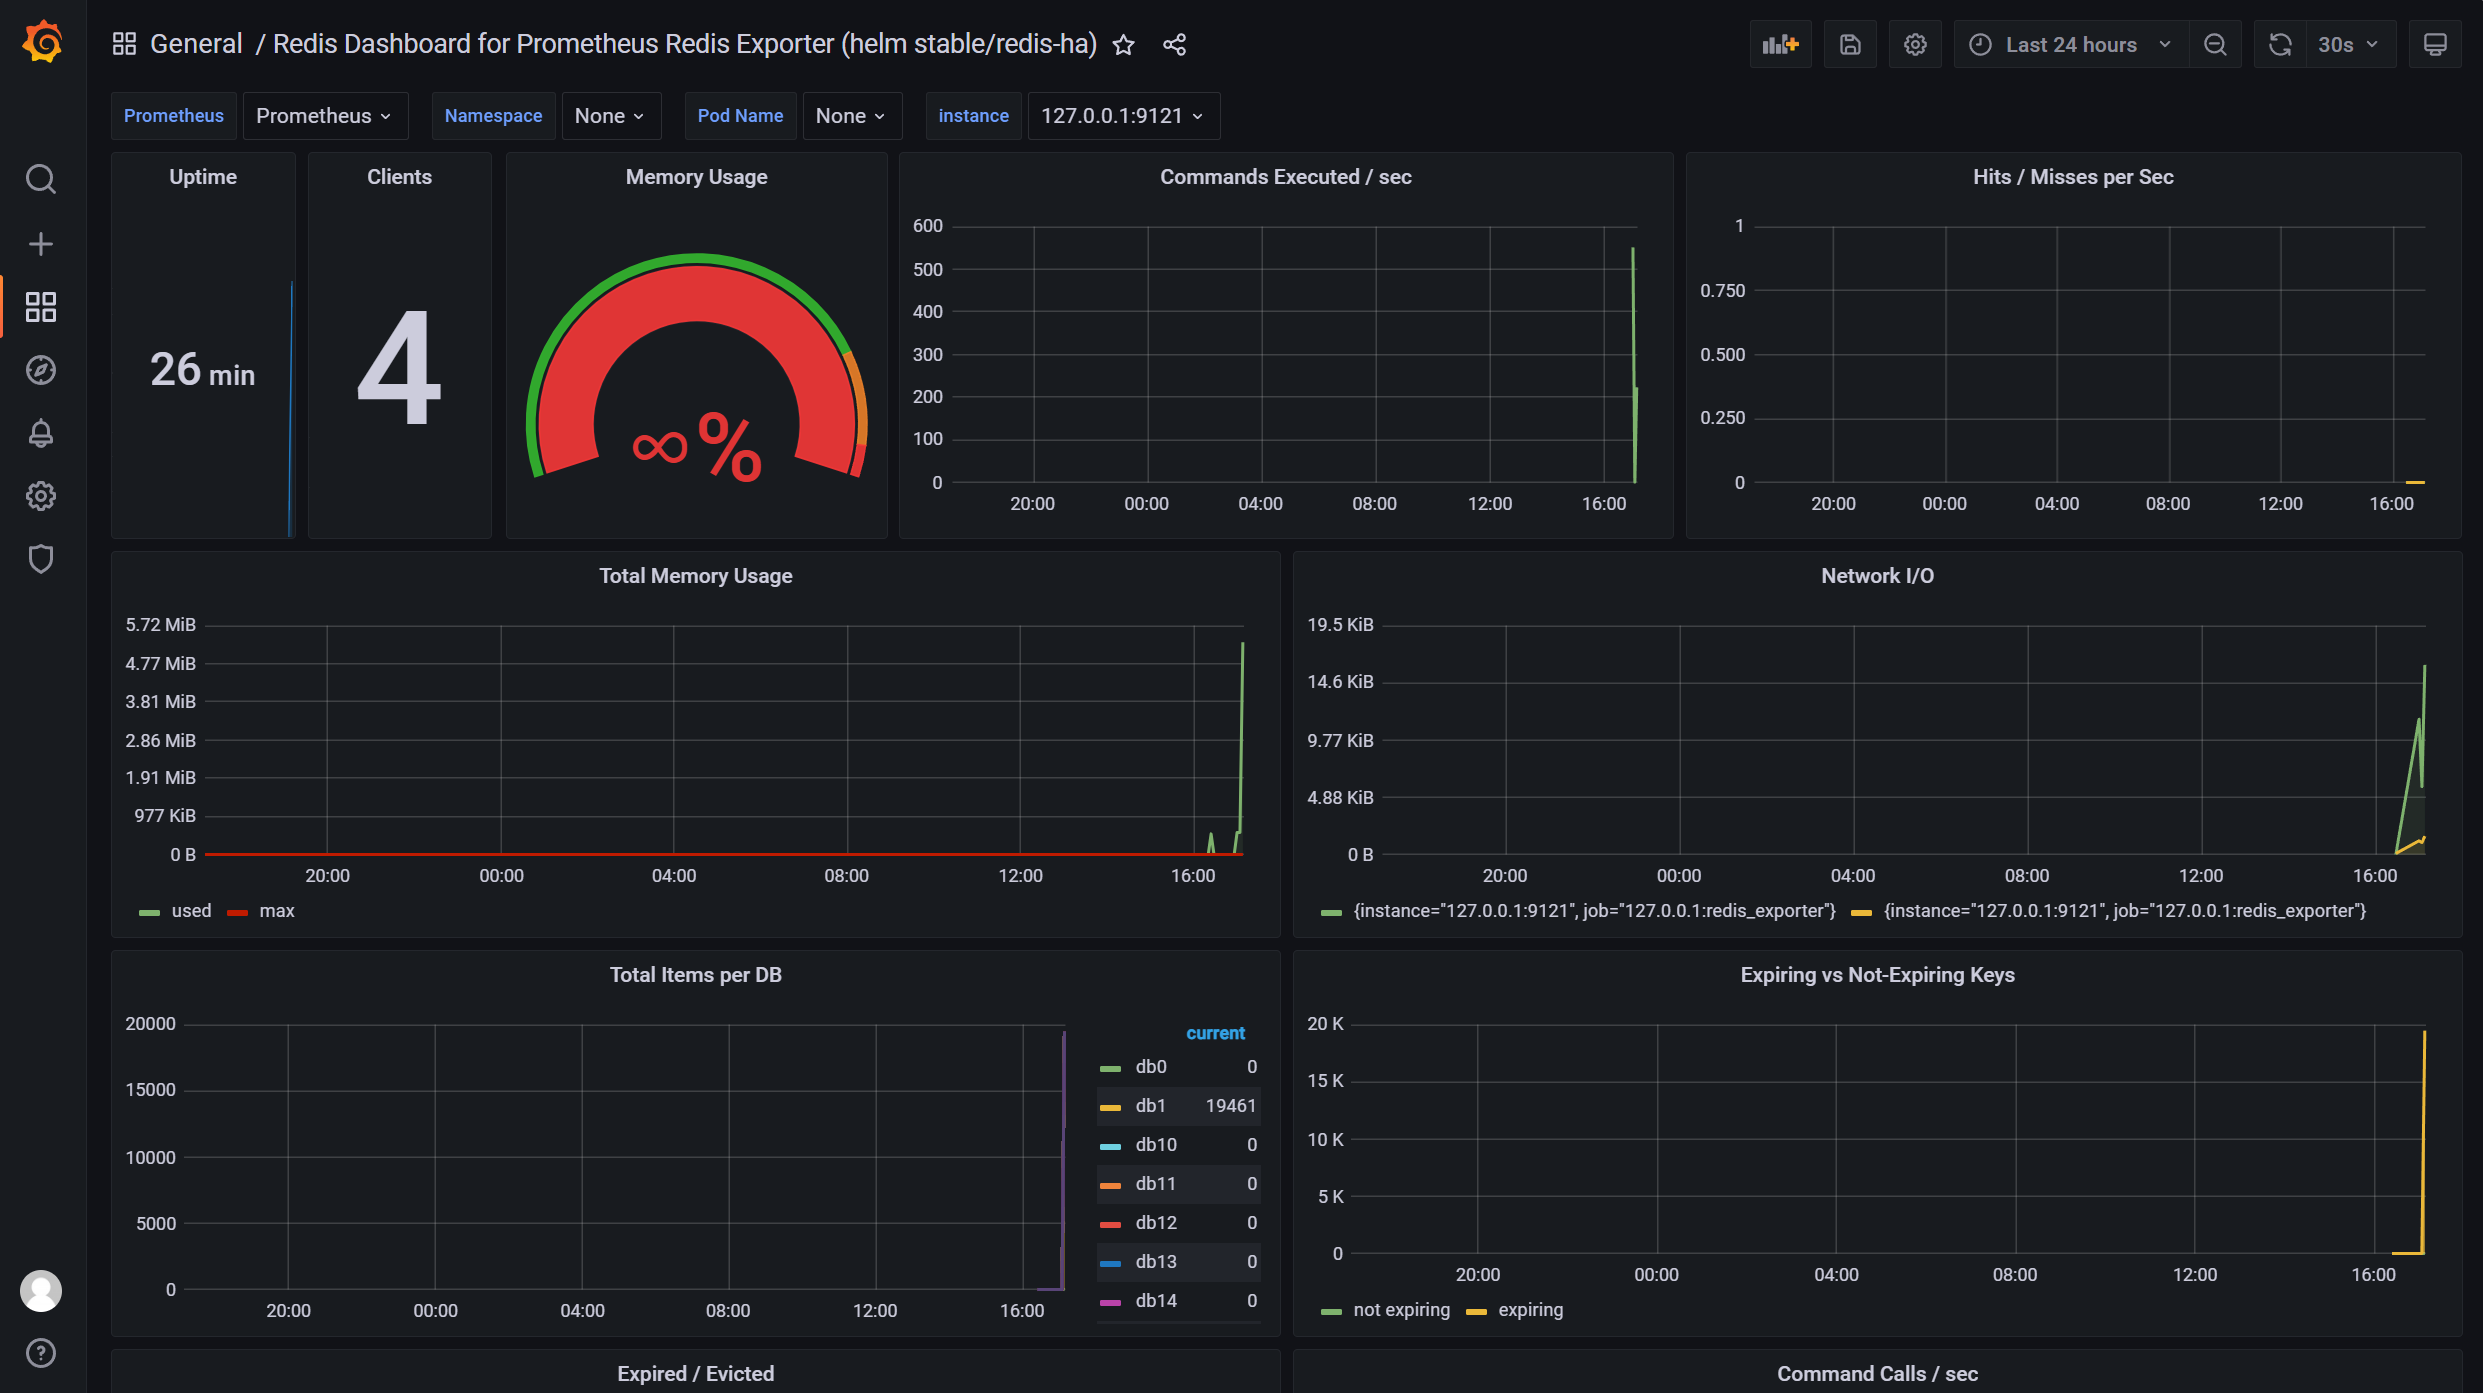
查看grafana,
最终redis监控面板如下图所示
springboot集成普罗米修斯监控
一、代码添加位置与完整实现
在 KafkaOrderConsumer 类中直接添加以下代码块(通常在类末尾,@PreDestroy 方法之前):
// 监控线程池指标的核心代码
@Bean
public MeterRegistryCustomizer<MeterRegistry> threadPoolMetrics() {
    return registry -> {
        // 监控活跃线程数
        Gauge.builder("order.threadpool.active.threads", executor, ThreadPoolExecutor::getActiveCount)
            .description("当前活跃线程数")
            .register(registry);

        // 监控队列堆积大小
        Gauge.builder("order.threadpool.queue.size", executor,
            pool -> pool.getQueue().size())
            .description("线程池队列大小")
            .register(registry);
    };
}
application.yml中添加
# application.yml
management:
  endpoints:
    web:
      exposure:
        include: prometheus,metrics
二、必须的依赖引入
在 pom.xml 中添加 Micrometer 和 Actuator 依赖:
<!-- Spring Boot Actuator -->
<dependency>
    <groupId>org.springframework.boot</groupId>
    <artifactId>spring-boot-starter-actuator</artifactId>
</dependency>

<!-- Prometheus 监控集成 -->
<dependency>
    <groupId>io.micrometer</groupId>
    <artifactId>micrometer-registry-prometheus</artifactId>
</dependency>
三、需要导入的类
在 KafkaOrderConsumer.java 文件头部添加以下导入:
import io.micrometer.core.instrument.Gauge;
import io.micrometer.core.instrument.MeterRegistry;
import io.micrometer.core.instrument.binder.MeterBinder;
import org.springframework.boot.actuate.autoconfigure.metrics.MeterRegistryCustomizer;
四、完整代码结构示例
public class KafkaOrderConsumer {
    // 原有依赖注入和线程池定义...

    @Resource
    private IVoucherOrderService voucherOrderService;

    private final ThreadPoolExecutor executor = new ThreadPoolExecutor(...);

    // 新增的监控代码块
    @Bean
    public MeterRegistryCustomizer<MeterRegistry> threadPoolMetrics() {
        return registry -> {
            Gauge.builder("order.threadpool.active.threads", executor, ThreadPoolExecutor::getActiveCount)
                .register(registry);
            Gauge.builder("order.threadpool.queue.size", executor,
                pool -> pool.getQueue().size())
                .register(registry);
        };
    }

    @PreDestroy
    public void shutdown() { ... }
}
五、修改prometheus配置文件并验证是否生效
- Prometheus 抓取配置检查
- 查看 Prometheus 配置文件 prometheus.yml
scrape_configs:
  - job_name: 'spring-app'
    metrics_path: '/actuator/prometheus' # 这个和上面一致
    static_configs:
      - targets: ['localhost:8081']  # 确保此处是应用的真实IP和端口
    scrape_interval: 5s              # 抓取间隔建议5秒
- 检查 Prometheus 抓取状态
访问 http://localhost:9090/targets,找到对应 job:
✅ 正常状态:State 显示 UP
❌ 异常状态:红色 DOWN(需检查网络或配置)
-
启动应用,访问监控端点:
http://localhost:8081/actuator/prometheus -
搜索指标名称:
# 活跃线程数 order_threadpool_active_threads # 队列堆积 order_threadpool_queue_size -
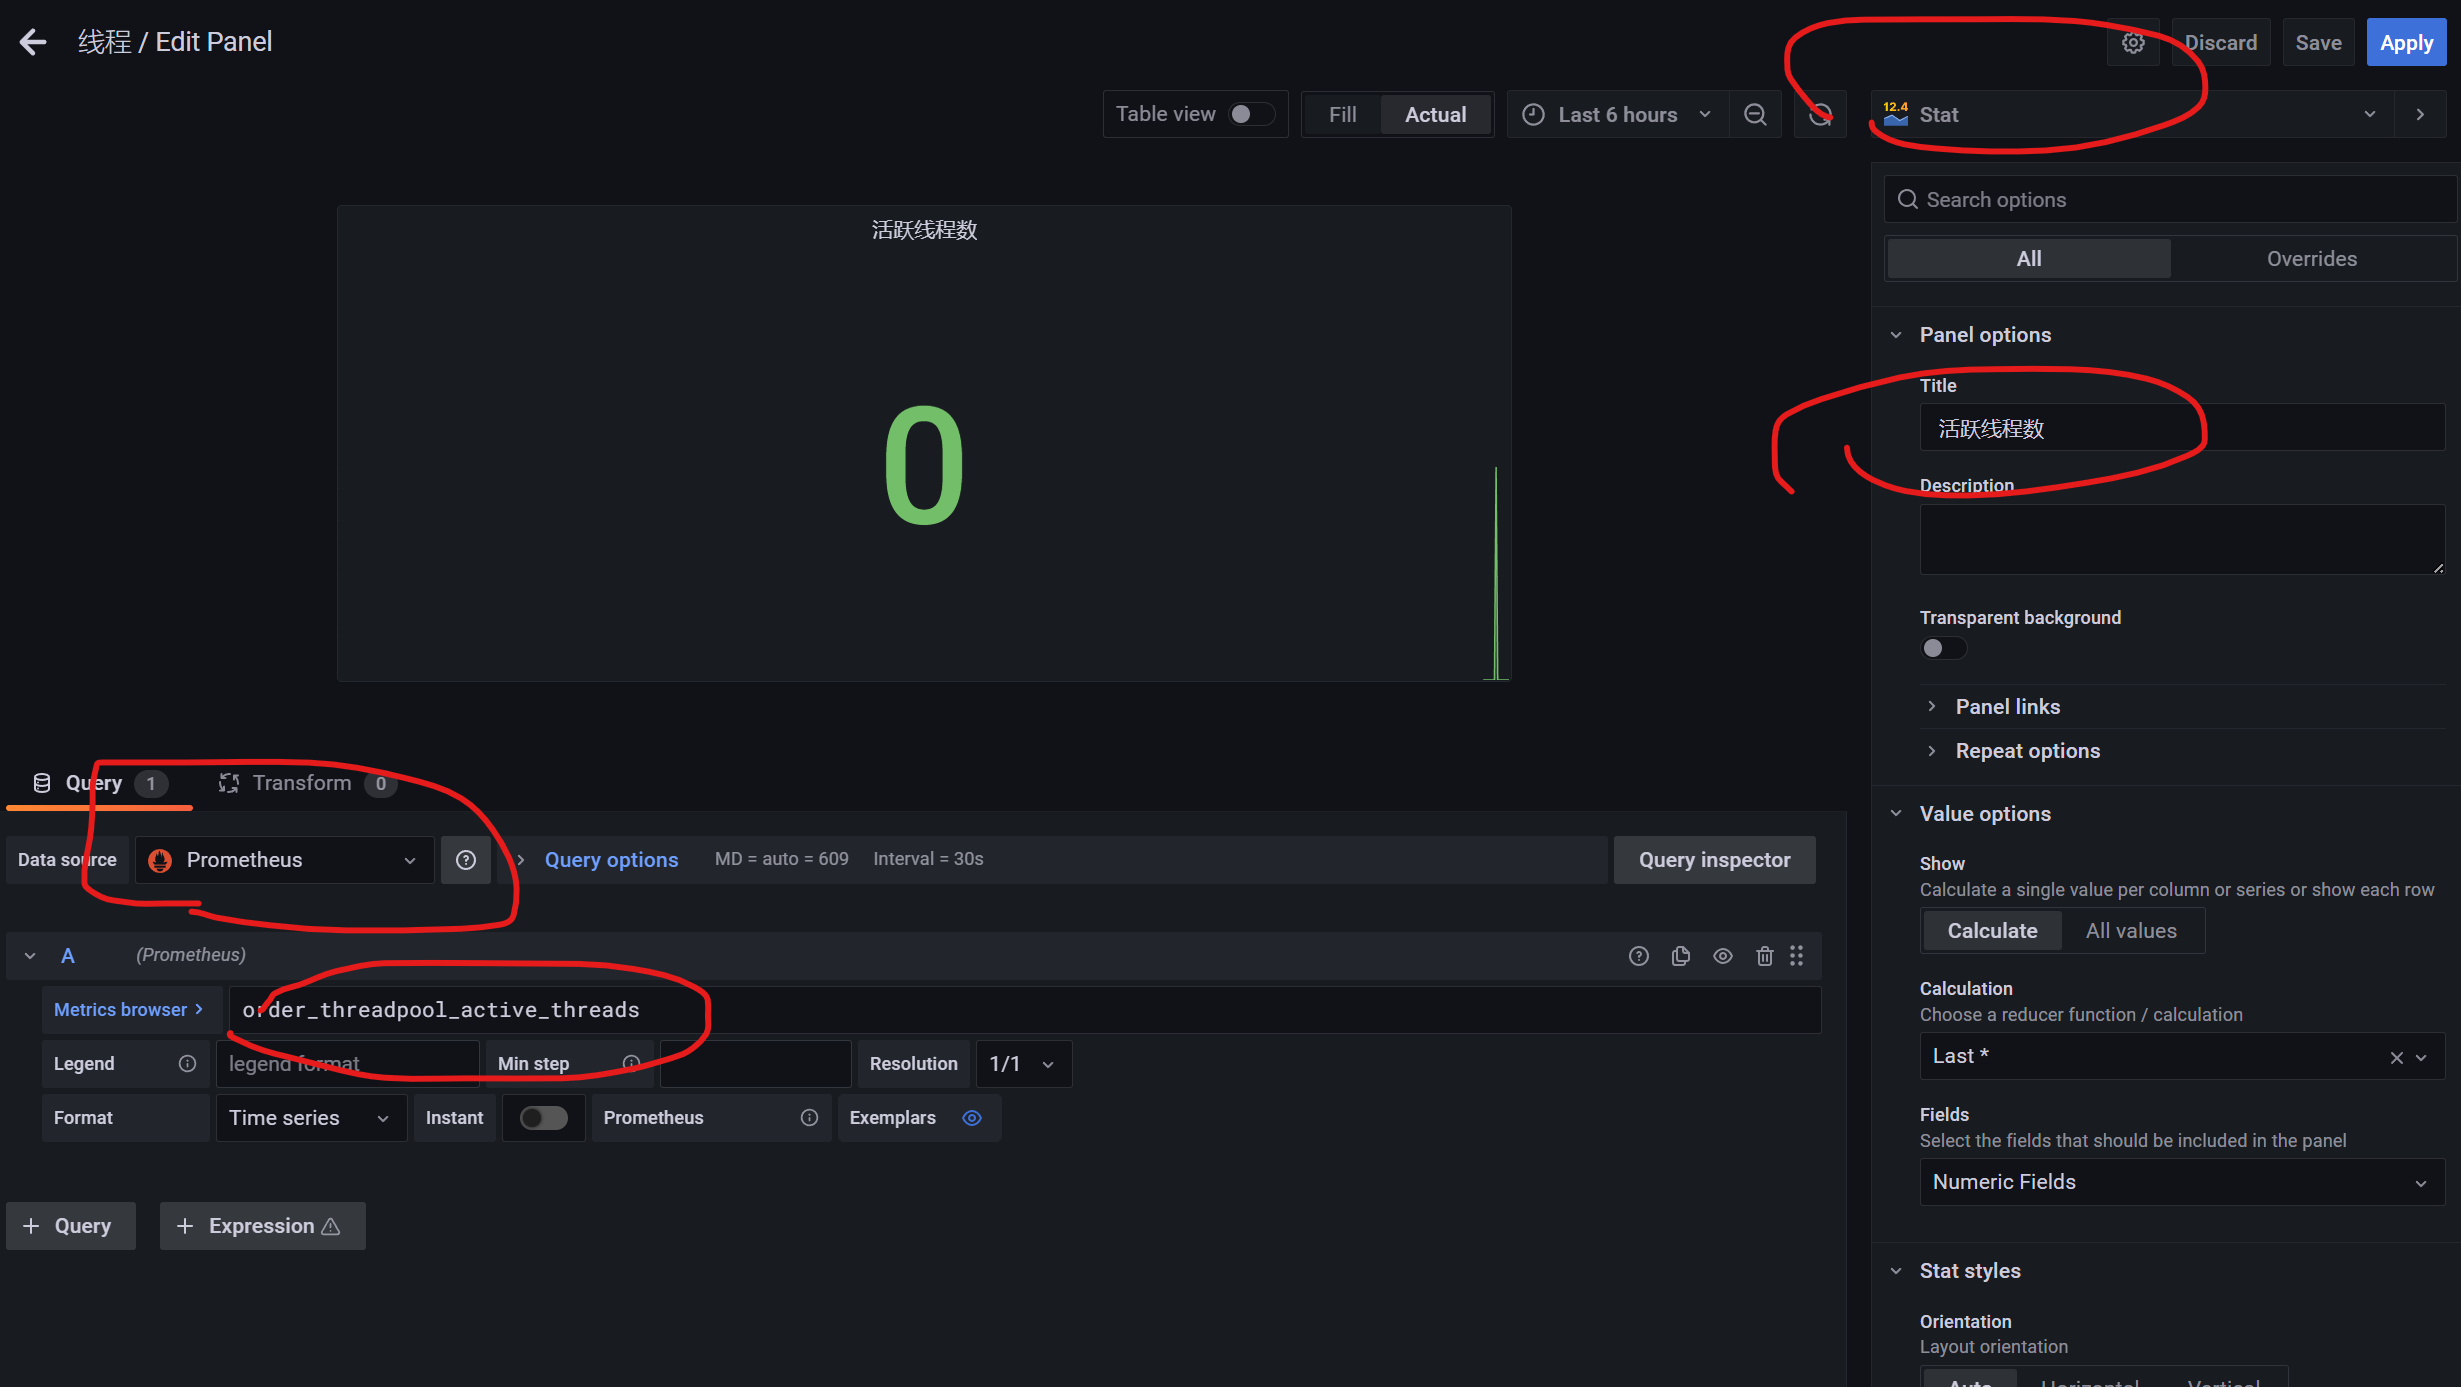
在 Grafana 中配置监控面板:
六、注意事项
- 线程池命名:如果存在多个线程池,需通过
tag()方法区分:Gauge.builder("order.threadpool.active.threads", executor, ThreadPoolExecutor::getActiveCount) .tag("poolName", "orderProcessor") // 添加标签 .register(registry); - 指标维度:可添加业务标签(如服务名):
.tag("service", "voucher-service")


 1602
1602

 被折叠的 条评论
为什么被折叠?
被折叠的 条评论
为什么被折叠?
 到【灌水乐园】发言


