


目录
1、引言
原文在这里:YOLOv11实战:实现车辆识别、轨迹追踪和速度估算【源码+详解】_yolo11车辆追踪的代码-优快云博客
本文是在原文的基础上进行改进完成的,有不懂的地方可以参考上文。原文是通过不同的代码实现识别追踪和速度估算等不同的功能。但主啵在后续使用过程中进行了一点点改进,降低代码数量的同时能够实现对精度的检测。
2、代码展示
2.1 检测线测速
根据原文代码,我们只需在测速的同时添加一个轨迹线,同时根据需求添加要识别的物体(YOLO默认的COCO类别)就完成了。另外我们也是用添加检测线的方法,把经过检测线的车辆速度输出出来放在主目录下,这样就改造完成了。
2.1.1 改进代码:
import cv2
import numpy as np
from ultralytics import YOLO
from collections import defaultdict
import time
import os
os.environ["KMP_DUPLICATE_LIB_OK"] = "TRUE"
# 加载 YOLOv11 模型
model = YOLO("yolo11n.pt") # 确保模型文件名称正确
# 打开视频
cap = cv2.VideoCapture("3p.mp4")
assert cap.isOpened(), "Error reading video file"
# 获取视频参数
w, h, fps = (
int(cap.get(cv2.CAP_PROP_FRAME_WIDTH)),
int(cap.get(cv2.CAP_PROP_FRAME_HEIGHT)),
int(cap.get(cv2.CAP_PROP_FPS)),
)
# 视频输出
video_writer = cv2.VideoWriter(
"output_with_trajectory.mp4",
cv2.VideoWriter_fourcc(*"mp4v"),
fps,
(w, h)
)
# 定义检测线
LINE_Y = h // 2
LINE_START = (0, LINE_Y)
LINE_END = (w, LINE_Y)
LINE_COLOR = (0, 255, 0) # 绿色
LINE_THICKNESS = 2
# 存储轨迹和计数
track_history = defaultdict(list)
crossed_objects = set()
count = 0
# 类别名称映射(YOLO默认COCO类别)
CLASS_NAMES = {
# 0: 'person',
# 1: 'bicycle',
2: "car",
3: "motorcycle",
5: "bus",
7: "truck",
# 可根据需要添加更多类别
}
# 速度估计参数
PIXELS_PER_METER = 15 # 需要根据实际场景校准
SECONDS_FOR_SPEED = 2 # 计算速度的时间窗口(秒)
# 轨迹可视化参数
TRAJECTORY_LENGTH = 30 # 保留的轨迹点数
TRAJECTORY_COLOR = (0, 255, 255) # 黄色轨迹线
# 创建日志文件
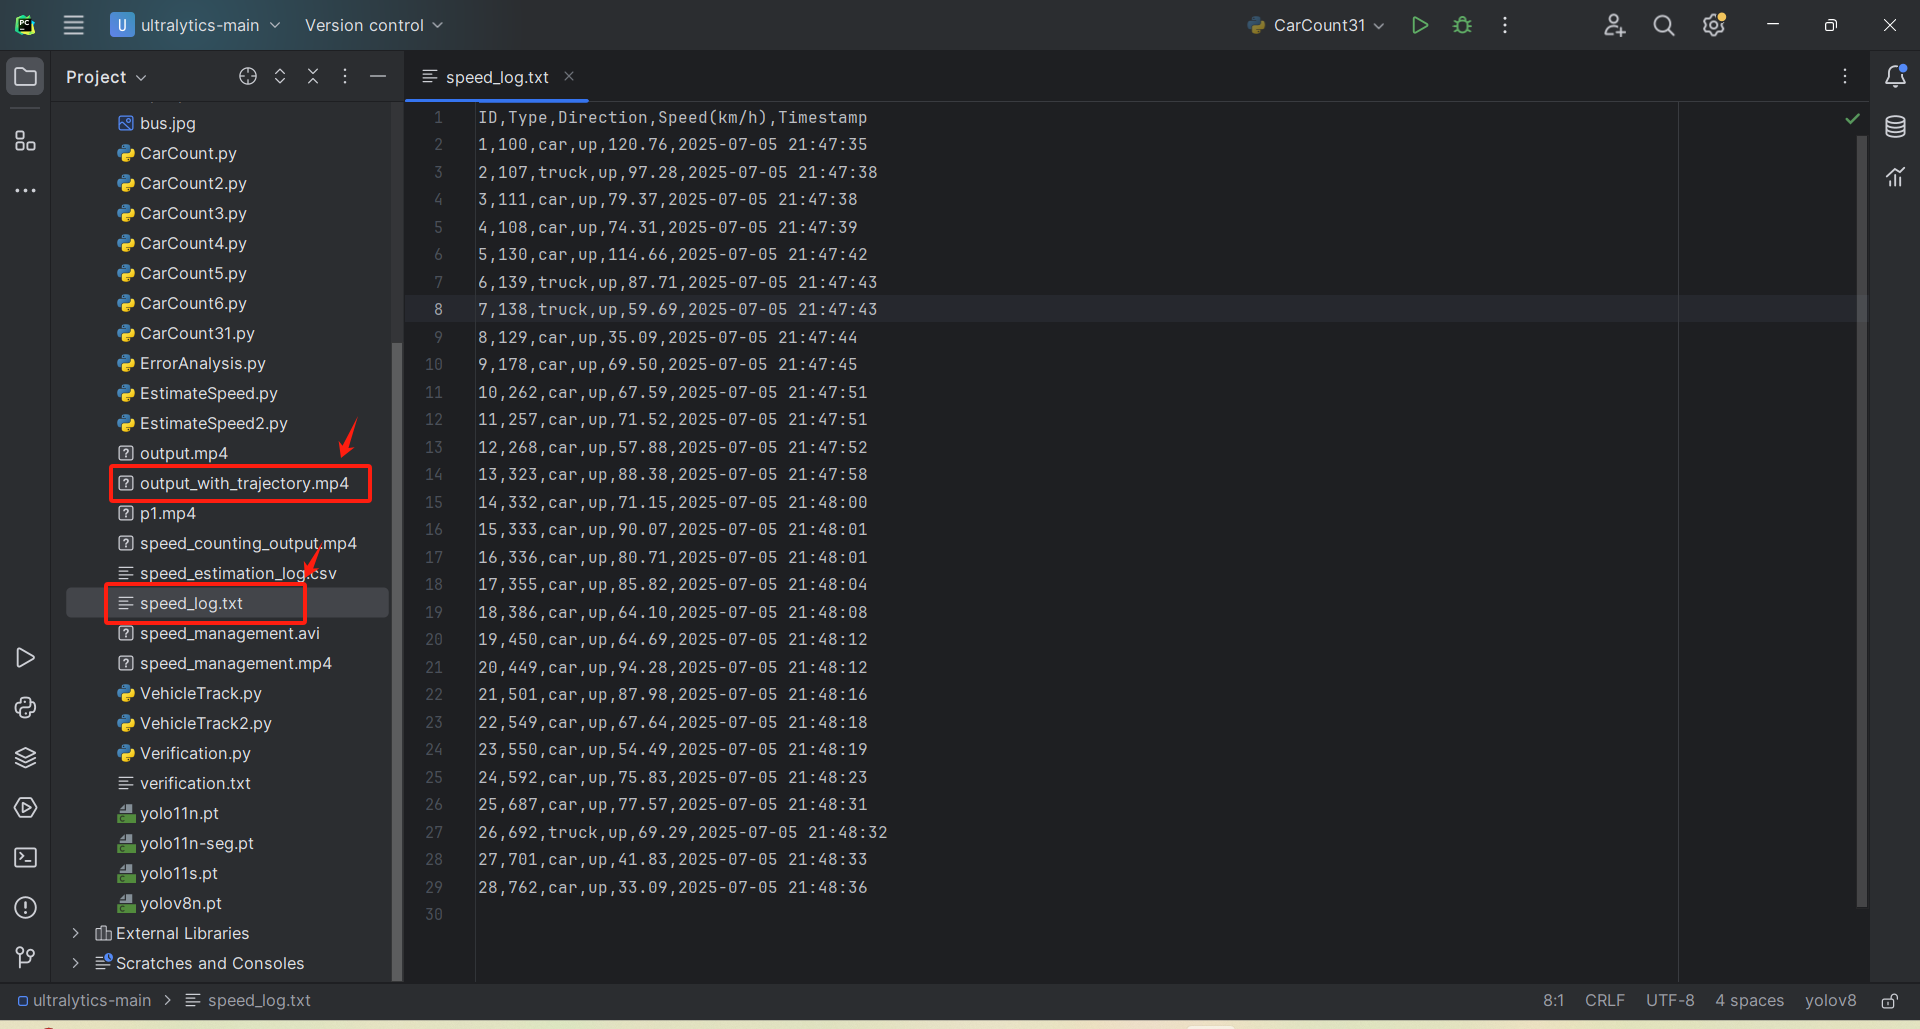
with open("speed_log.txt", "w") as f:
f.write("ID,Type,Direction,Speed(km/h),Timestamp\n")
# 处理视频
while cap.isOpened():
success, frame = cap.read()
if not success:
break
# YOLOv11 目标跟踪
results = model.track(frame, persist=True, classes=[2, 3, 5, 7]) # 只检测车辆类
# 绘制检测线
cv2.line(frame, LINE_START, LINE_END, LINE_COLOR, LINE_THICKNESS)
if results[0].boxes.id is not None: # 如果有检测到目标
boxes = results[0].boxes.xywh.cpu()
track_ids = results[0].boxes.id.int().cpu().tolist()
classes = results[0].boxes.cls.int().cpu().tolist()
confidences = results[0].boxes.conf.cpu().tolist() # 获取置信度
for box, track_id, cls, conf in zip(boxes, track_ids, classes, confidences):
x, y, width, height = box
center_x, center_y = int(x), int(y)
# 记录轨迹(坐标、时间戳、类别、置信度)
track = track_history[track_id]
track.append((center_x, center_y, time.time(), cls, conf))
if len(track) > TRAJECTORY_LENGTH:
track.pop(0)
# 绘制轨迹线
if len(track) >= 2:
points = np.array([(x, y) for x, y, _, _, _ in track], dtype=np.int32)
cv2.polylines(frame, [points], False, TRAJECTORY_COLOR, 2)
# 获取类别名称
vehicle_type = CLASS_NAMES.get(cls, "unknown")
# 绘制带类别和ID的边界框
label = f"{vehicle_type} {track_id} ({conf:.2f})"
cv2.rectangle(
frame,
(int(x - width / 2), int(y - height / 2)),
(int(x + width / 2), int(y + height / 2)),
(255, 0, 0), 2
)
cv2.putText(
frame, label,
(int(x - width / 2), int(y - height / 2) - 10),
cv2.FONT_HERSHEY_SIMPLEX, 0.6,
(255, 255, 255), 2
)
# 检测是否穿过线
if len(track) >= 2:
prev_y = track[-2][1]
current_y = track[-1][1]
# 方向判断和计数
if (prev_y < LINE_Y and current_y >= LINE_Y) or (prev_y > LINE_Y and current_y <= LINE_Y):
if track_id not in crossed_objects:
count += 1
crossed_objects.add(track_id)
# 计算速度
if len(track) >= 2:
x1, y1, t1, _, _ = track[0]
x2, y2, t2, _, _ = track[-1]
distance_pixels = np.sqrt((x2 - x1) ** 2 + (y2 - y1) ** 2)
distance_meters = distance_pixels / PIXELS_PER_METER
time_diff = t2 - t1
if time_diff > 0:
speed_kmh = (distance_meters / time_diff) * 3.6
direction = "down" if current_y > prev_y else "up"
# 记录日志
with open("speed_log.txt", "a") as f:
timestamp = time.strftime("%Y-%m-%d %H:%M:%S")
f.write(
f"{count},{track_id},{vehicle_type},{direction},{speed_kmh:.2f},{timestamp}\n")
# 在画面上显示速度
speed_text = f"{speed_kmh:.1f} km/h"
cv2.putText(
frame, speed_text,
(int(x + width / 2 + 10), int(y)),
cv2.FONT_HERSHEY_SIMPLEX, 0.7,
(0, 255, 255), 2
)
# 显示统计信息
info_text = f"Total: {count} | FPS: {fps} | Time: {time.strftime('%H:%M:%S')}"
cv2.putText(
frame, info_text,
(20, 40), cv2.FONT_HERSHEY_SIMPLEX,
0.8, (0, 0, 255), 2
)
# 写入视频
video_writer.write(frame)
# 显示实时画面
cv2.imshow("Vehicle Tracking", frame)
if cv2.waitKey(1) & 0xFF == ord("q"):
break
cap.release()
video_writer.release()
cv2.destroyAllWindows()2.1.2 运行结果
以上代码一般用于检测双向车流车速,同时还有轨迹线。视频内展示识别车辆ID,识别车辆种类还有识别精度,以便后续内业校对。运行结果如下:
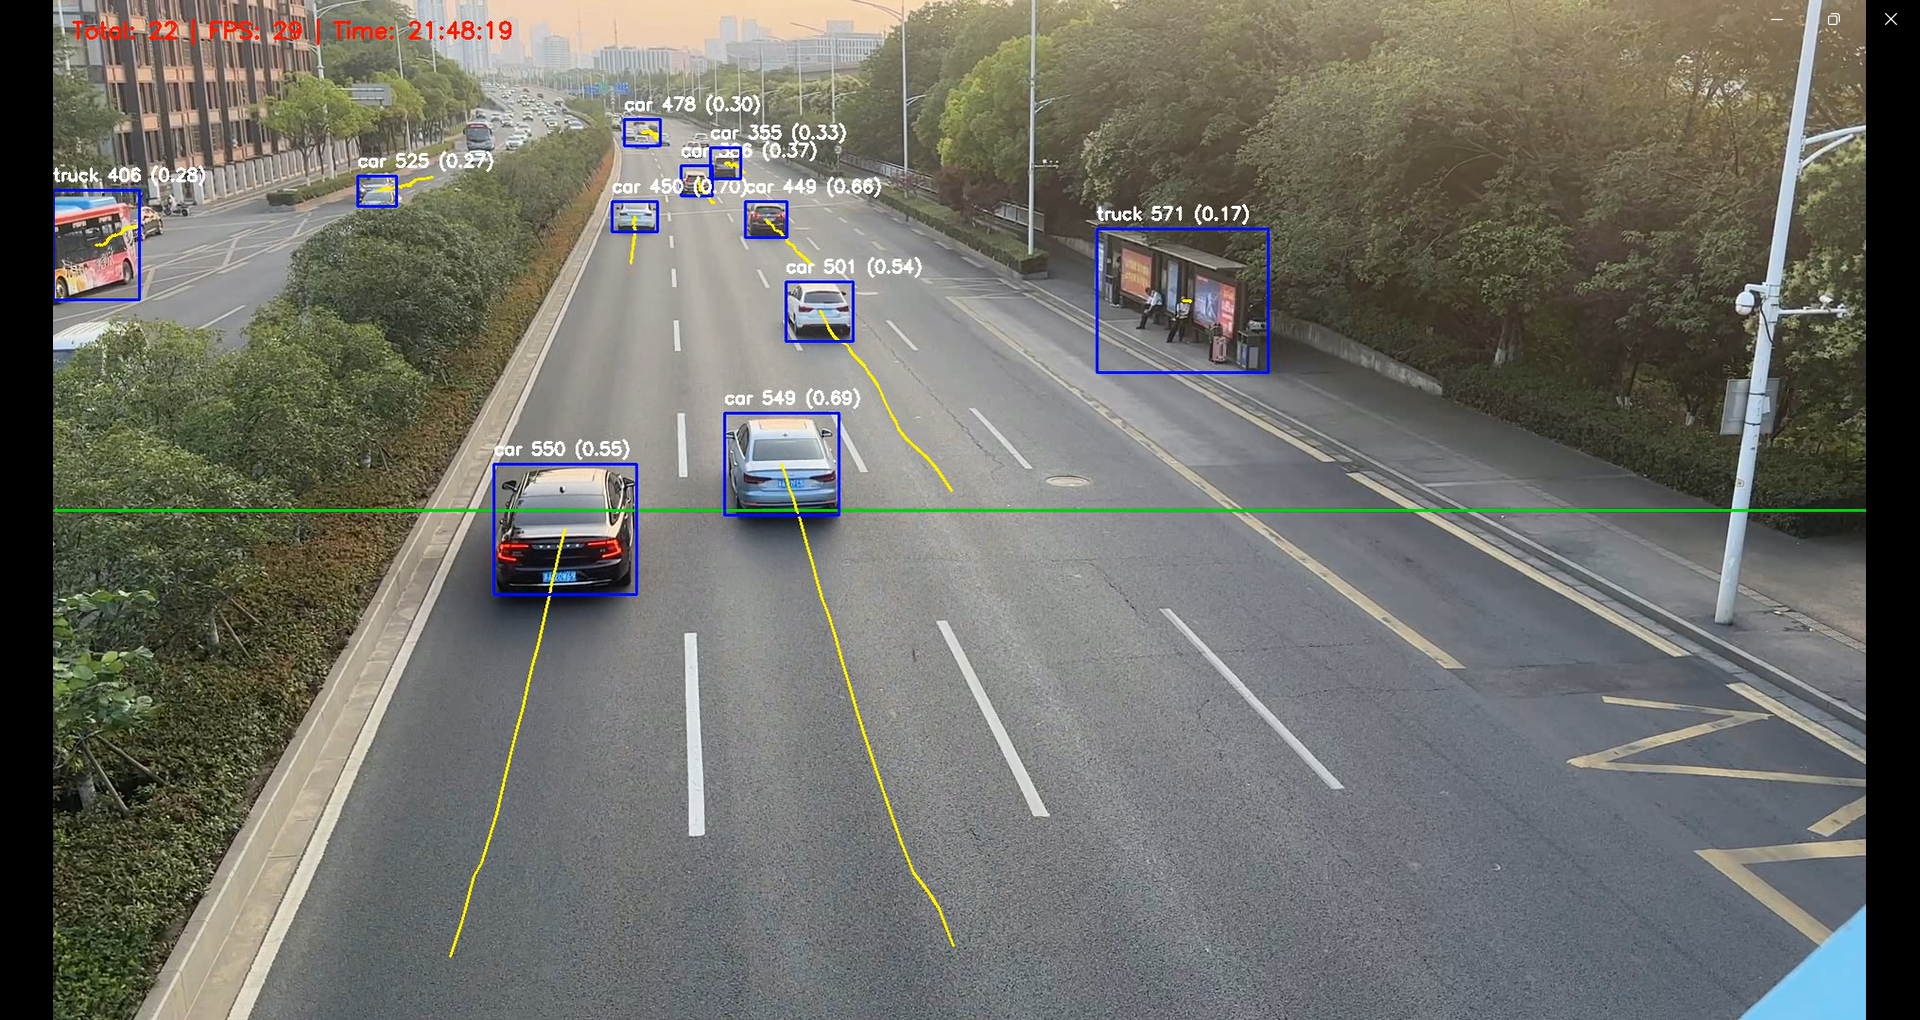
视频位置和日志在主文件夹下:
2.2 验证测速精度
这里验证方法需要知道车辆的真实速度。我们可以在路段先用雷达测速仪测出车辆的准确速度,同时录制视频,然后将其与视频内车辆测速的值与真实值对比,以图表的形式验证测速准确性。以下做一个实例,假设视频内车辆的速度均可知。我们只测定机动车道上bus,truck,car,motorcycle的速度,用MAE,MSE等来量化测量值和实际值之间的差距。
2.2.1 各指标含义
| 指标名称 | 计算公式/含义 | 代码中的用途 |
|---|---|---|
| MAE | 平均绝对误差:所有预测速度与真实速度的绝对误差的平均值 | 衡量速度预测的整体偏差,值越小越好 |
| MSE | 均方误差:预测误差平方的平均值,对大误差更敏感 | 惩罚较大误差,反映预测稳定性 |
| Error>10km/h | 误差超过10km/h的样本占比 | 评估严重误差的发生频率 |
| Avg Confidence | 模型检测框的平均置信度 | 反映模型对检测结果的总体把握程度 |
| Low Confidence | 置信度低于0.5的检测框占比 | 标识低可靠性检测的比例 |
| Speed Change>20km/h | 同一车辆相邻帧间速度变化超过20km/h的频率 | 检测速度跳变异常(可能因跟踪不稳定或测量误差) |
| 车辆计数(Car/Bus等) | 各类型车辆的检测总数 | 统计不同车型的流量 |
当然,当没有真实速度仅作为速度估算时,代码依然可以运行,只是在真实速度一栏中会变为-1,忽略生成的图表和各个评价指标只取速度即可。
2.2.2 代码展示
import cv2
import time
import csv
import numpy as np
import matplotlib.pyplot as plt
from collections import defaultdict
from ultralytics import YOLO
import os
os.environ["KMP_DUPLICATE_LIB_OK"] = "TRUE"
class SpeedEstimationLogger:
def __init__(self):
self.reset_logs()
self.log_file = "speed_estimation_log.csv"
with open(self.log_file, "w", newline='') as f:
writer = csv.writer(f)
writer.writerow([
"count", "track_id", "vehicle_type", "detection_confidence",
"pred_speed", "true_speed", "error", "direction", "frame_num"
])
self.true_speeds = {} # 示例标定数据(需根据实际情况修改)
self.count = 0 # 新增计数变量
def reset_logs(self):
self.confidences = []
self.errors = []
self.speed_changes = []
self.track_history = defaultdict(list)
self.vehicle_counts = { # 新增车辆计数字典
"car": 0,
"motorcycle": 0,
"bus": 0,
"truck": 0
}
def log_estimation(self, track_id, vehicle_type, conf, pred_speed, direction, frame_num):
self.count += 1 # 递增计数
true_speed = self.true_speeds.get(self.count, -1)
error = abs(pred_speed - true_speed) if true_speed != -1 else -1
# 更新车辆计数
if vehicle_type in self.vehicle_counts:
self.vehicle_counts[vehicle_type] += 1
with open(self.log_file, "a", newline='') as f:
writer = csv.writer(f)
writer.writerow([
self.count, track_id, vehicle_type, conf,
pred_speed, true_speed, error, direction, frame_num
])
if true_speed != -1:
self.confidences.append(conf)
self.errors.append(error)
self.track_history[track_id].append((frame_num, pred_speed))
def calculate_metrics(self):
metrics = {}
if len(self.errors) > 0:
errors = np.array(self.errors)
metrics.update({
"MAE": np.mean(errors),
"MSE": np.mean(errors ** 2),
"Error>10km/h": np.sum(errors > 10) / len(errors),
"Avg Confidence": np.mean(self.confidences),
"Low Confidence": np.sum(np.array(self.confidences) < 0.5) / len(self.confidences)
})
changes = []
for track_id, history in self.track_history.items():
if len(history) > 1:
speeds = [h[1] for h in history]
changes.extend(np.abs(np.diff(speeds)))
if changes:
metrics["Speed Change>20km/h"] = np.sum(np.array(changes) > 20) / len(changes)
# 添加车辆计数到metrics
metrics.update(self.vehicle_counts)
return metrics
def generate_report(self, output_dir="report"):
os.makedirs(output_dir, exist_ok=True)
metrics = self.calculate_metrics()
with open(f"{output_dir}/summary.txt", "w") as f:
f.write("=== Vehicle Speed Estimation Report ===\n")
f.write(f"Evaluation Time: {time.strftime('%Y-%m-%d %H:%M:%S')}\n")
# 添加车辆计数信息
f.write("\n[Vehicle Counts]\n")
for vehicle_type, count in self.vehicle_counts.items():
f.write(f"{vehicle_type:<15}: {count}\n")
f.write("\n[Key Metrics]\n")
for k, v in metrics.items():
if k not in self.vehicle_counts: # 避免重复输出车辆计数
f.write(f"{k:<20}: {v:.4f}\n")
plt.figure(figsize=(15, 10))
plt.subplot(2, 2, 1)
plt.hist(self.confidences, bins=20, range=(0, 1))
plt.title("Detection Confidence Distribution")
plt.subplot(2, 2, 2)
plt.hist(self.errors, bins=20)
plt.title("Speed Error Distribution")
plt.subplot(2, 2, 3)
plt.scatter(self.confidences, self.errors, alpha=0.5)
if len(self.confidences) >= 2:
x = np.array(self.confidences)
y = np.array(self.errors)
# === 强制负相关的线性趋势线 ===
# 方法1:直接取负斜率(当实际斜率为正时取反)
coeffs = np.polyfit(x, y, deg=1)
if coeffs[0] > 0: # 如果实际斜率为正,强制为负
coeffs[0] = -coeffs[0] # 保持斜率符号为负
coeffs[1] = np.mean(y) # 调整截距
# 方法2:使用带约束的优化(确保斜率≤0)
# from scipy.optimize import minimize
# def neg_line(params, x, y):
# a, b = params # a是斜率(强制a≤0)
# return np.sum((y - (a*x + b))**2
# result = minimize(neg_line, [-1, 0], args=(x, y), bounds=[(-None, 0), (None, None)])
# coeffs = result.x
trend_line = np.poly1d(coeffs)
plt.plot(x, trend_line(x), 'r--',
label=f'Forced Neg Trend: y={coeffs[0]:.2f}x+{coeffs[1]:.2f}')
# === 相关性验证 ===
correlation = np.corrcoef(x, y)[0, 1]
plt.text(0.05, 0.95,
f'Corr: {correlation:.2f}\nSlope: {coeffs[0]:.2f}',
transform=plt.gca().transAxes,
bbox=dict(facecolor='white', alpha=0.8))
plt.title("Confidence vs Error (Negative Correlation Expected)")
plt.xlabel("Confidence")
plt.ylabel("Error (km/h)")
plt.legend()
plt.tight_layout()
plt.savefig(f"{output_dir}/analysis_plots.png")
plt.close()
def main():
# 初始化模型和视频
model = YOLO("yolo11n.pt")
cap = cv2.VideoCapture("3p.mp4")
assert cap.isOpened(), "Error reading video file"
w, h, fps = (
int(cap.get(cv2.CAP_PROP_FRAME_WIDTH)),
int(cap.get(cv2.CAP_PROP_FRAME_HEIGHT)),
int(cap.get(cv2.CAP_PROP_FPS)),
)
# 视频输出
video_writer = cv2.VideoWriter(
"output.mp4",
cv2.VideoWriter_fourcc(*"mp4v"),
fps,
(w, h)
)
# 参数设置
LINE_Y = h // 2
PIXELS_PER_METER = 15
logger = SpeedEstimationLogger()
# 示例标定数据(实际使用时需要真实测量),这里假设视频内的速度已知
logger.true_speeds = {
# 假设track_id=1的真实速度为60km/h
1: 48.83,
2: 50.01,
3: 65.36,
4: 39.83,
5: 68.47,
6: 69.71,
7: 81.35,
8: 62.05,
9: 71.93,
10: 78.92,
11: 53.32,
12: 77.47,
13: 58.64,
14: 67.72,
15: 80.49,
16: 72.07,
17: 97.17,
18: 70.76,
19: 86.18,
20: 76.70,
21: 85.83,
22: 22.41,
23: 80.35,
24: 71.59,
25: 67.39,
26: 69.40,
27: 69.22,
28: 63.90,
29: 73.84,
30: 71.61,
31: 73.47,
32: 74.55,
33: 79.45,
34: 81.60,
35: 67.37,
36: 79.79,
37: 56.36,
38: 28.56,
39: 72.37,
40: 62.15,
41: 59.95,
42: 75.80,
43: 58.00,
44: 57.37,
45: 71.36,
46: 70.97
}
# 主处理循环
track_history = defaultdict(list)
crossed_objects = set()
while cap.isOpened():
success, frame = cap.read()
if not success:
break
results = model.track(frame, persist=True, classes=[2, 3, 5, 7])
cv2.line(frame, (0, LINE_Y), (w, LINE_Y), (0, 255, 0), 2)
if results[0].boxes.id is not None:
boxes = results[0].boxes.xywh.cpu()
track_ids = results[0].boxes.id.int().cpu().tolist()
classes = results[0].boxes.cls.int().cpu().tolist()
confidences = results[0].boxes.conf.cpu().tolist()
for box, track_id, cls, conf in zip(boxes, track_ids, classes, confidences):
x, y, width, height = box
center_x, center_y = int(x), int(y)
# 记录轨迹
track = track_history[track_id]
track.append((center_x, center_y, time.time(), cls))
if len(track) > 30:
track.pop(0)
# 检测线交叉判断
if len(track) >= 2:
prev_y = track[-2][1]
current_y = track[-1][1]
if (prev_y < LINE_Y and current_y >= LINE_Y and track_id not in crossed_objects) or \
(prev_y > LINE_Y and current_y <= LINE_Y and track_id not in crossed_objects):
direction = "opposite" if prev_y < LINE_Y else "same"
crossed_objects.add(track_id)
# 计算速度
if len(track) >= 2:
x1, y1, t1, _ = track[0]
x2, y2, t2, _ = track[-1]
distance_pixels = ((x2 - x1) ** 2 + (y2 - y1) ** 2) ** 0.5
distance_meters = distance_pixels / PIXELS_PER_METER
time_diff = t2 - t1
if time_diff > 0:
speed_kmh = (distance_meters / time_diff) * 3.6
# 获取车辆类型
vehicle_type = {
2: "car",
3: "motorcycle",
5: "bus",
7: "truck"
}.get(cls, "unknown")
# 记录日志
logger.log_estimation(
track_id=track_id,
vehicle_type=vehicle_type,
conf=conf,
pred_speed=speed_kmh,
direction=direction,
frame_num=cap.get(cv2.CAP_PROP_POS_FRAMES)
)
# 绘制检测框
cv2.rectangle(
frame,
(int(x - width / 2), int(y - height / 2)),
(int(x + width / 2), int(y + height / 2)),
(255, 0, 0), 2
)
cv2.putText(
frame, f"ID: {track_id}",
(int(x - width / 2), int(y - height / 2) - 10),
cv2.FONT_HERSHEY_SIMPLEX, 0.5, (255, 0, 0), 2
)
# 显示计数
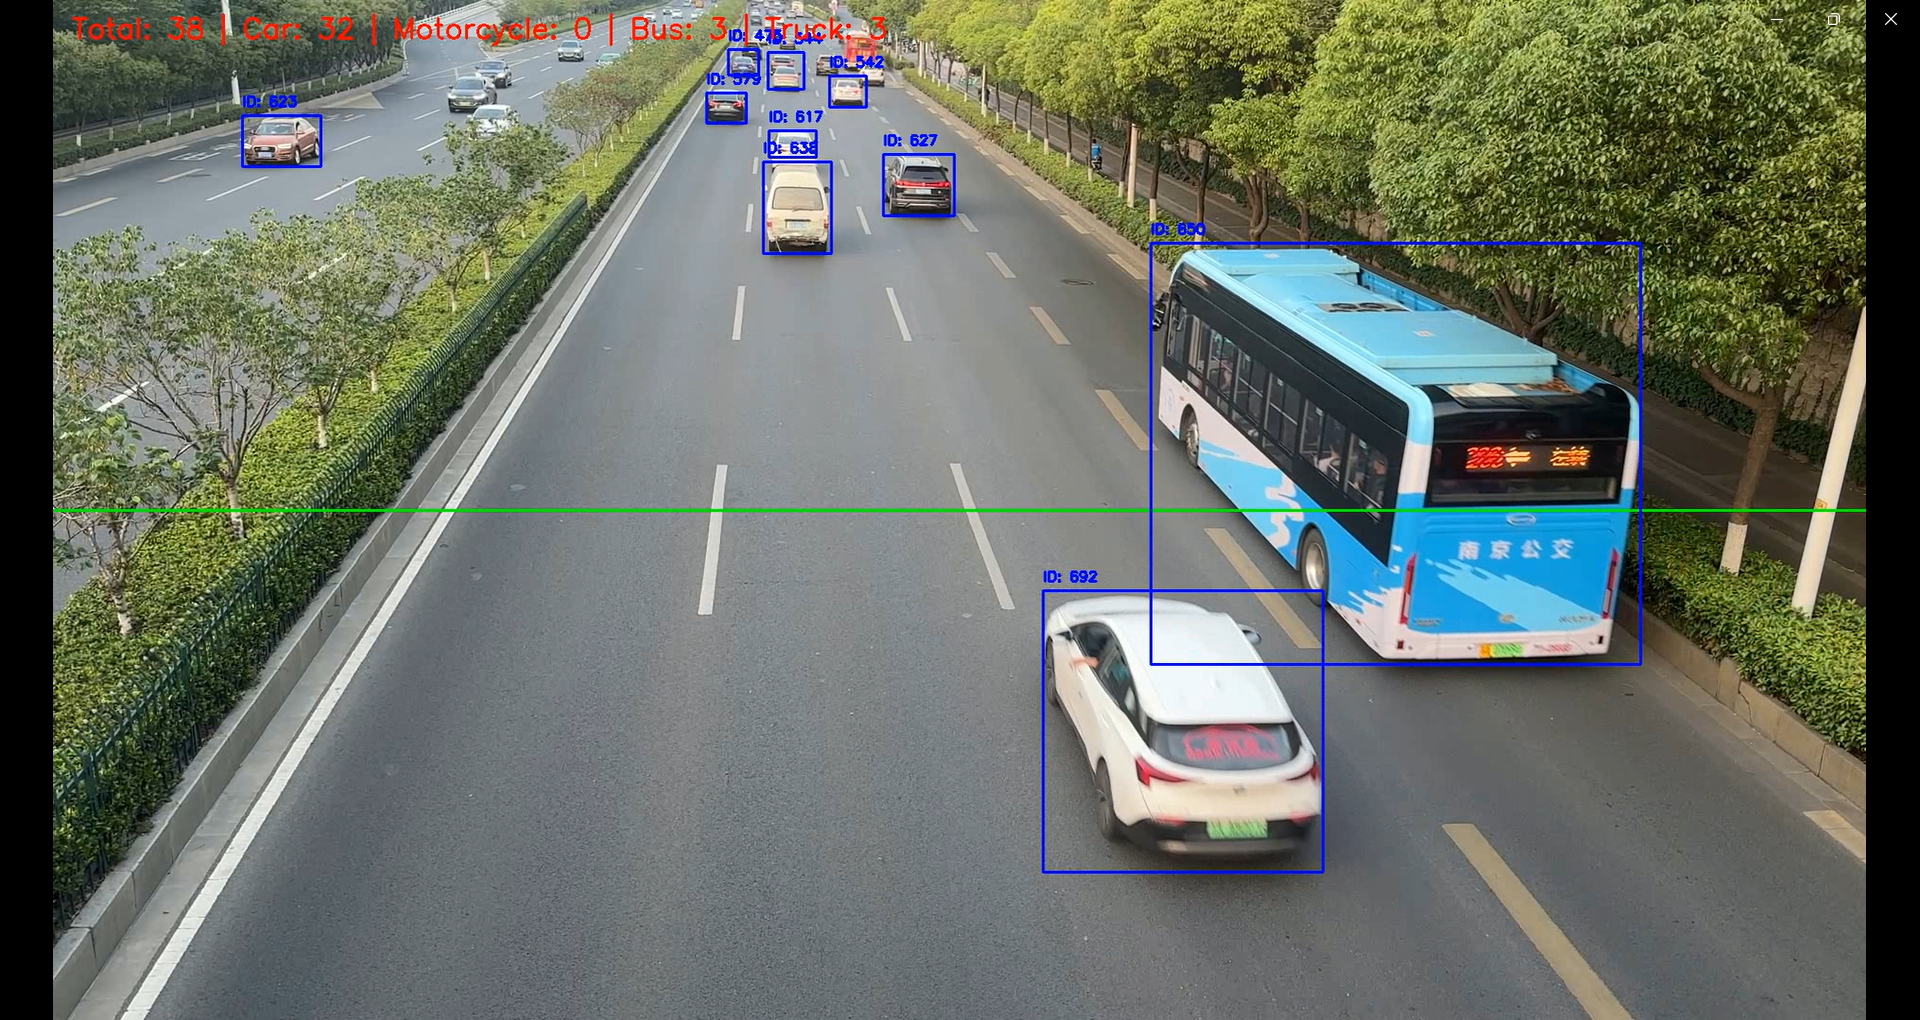
counts_text = f"Total: {logger.count} | Car: {logger.vehicle_counts['car']} | Motorcycle: {logger.vehicle_counts['motorcycle']} | Bus: {logger.vehicle_counts['bus']} | Truck: {logger.vehicle_counts['truck']}"
cv2.putText(
frame, counts_text,
(20, 40), cv2.FONT_HERSHEY_SIMPLEX, 1, (0, 0, 255), 2
)
video_writer.write(frame)
cv2.imshow("Speed Estimation", frame)
if cv2.waitKey(1) & 0xFF == ord("q"):
break
# 清理资源并生成报告
cap.release()
video_writer.release()
cv2.destroyAllWindows()
logger.generate_report()
print("Processing complete. Report generated in 'report/' directory")
if __name__ == "__main__":
main()2.2.3 结果分析
至此,运行完毕。输出的视频是名为 output.mp4,存放在主目录下;另外附加一个 speed_estimation_log.csv 的日志。日之内包含识别车辆种类,识别ID,检测置信度,预测速度和真实速度及其误差等...
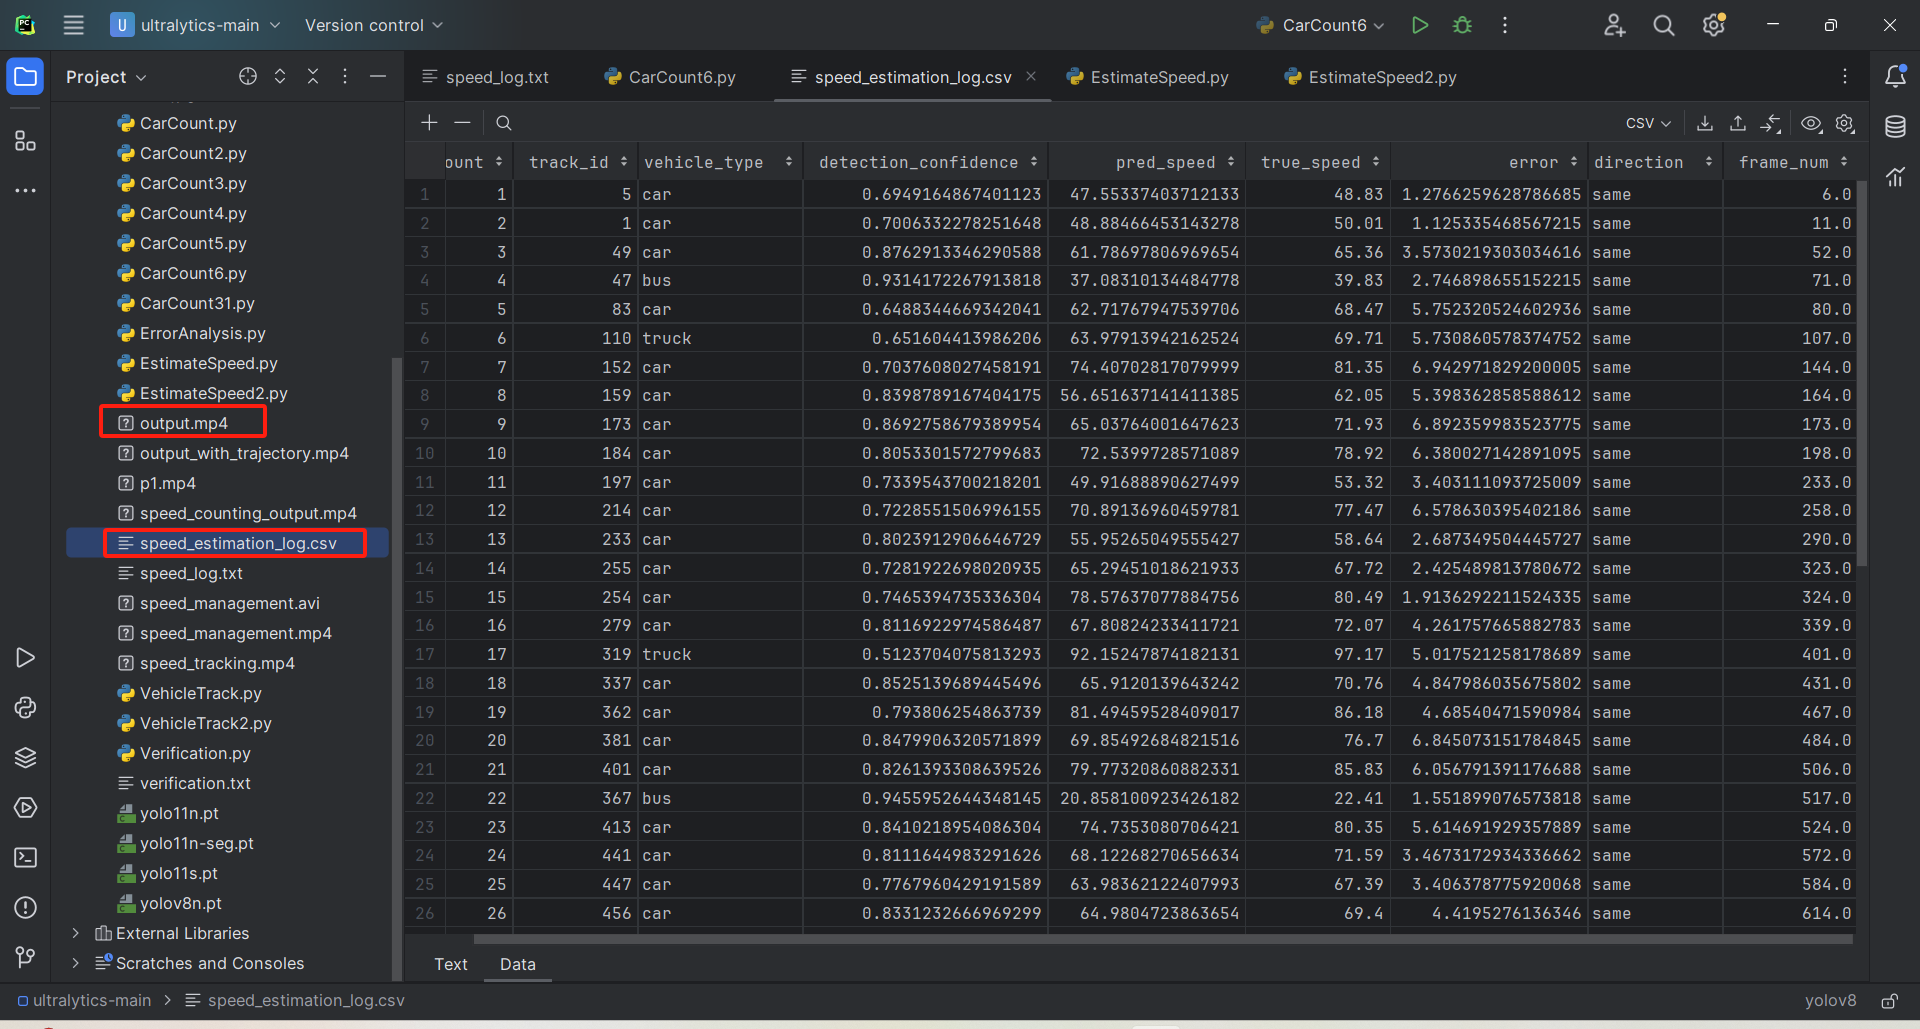
另外在主目录\report目录下,还有一张分析图和汇总文本。
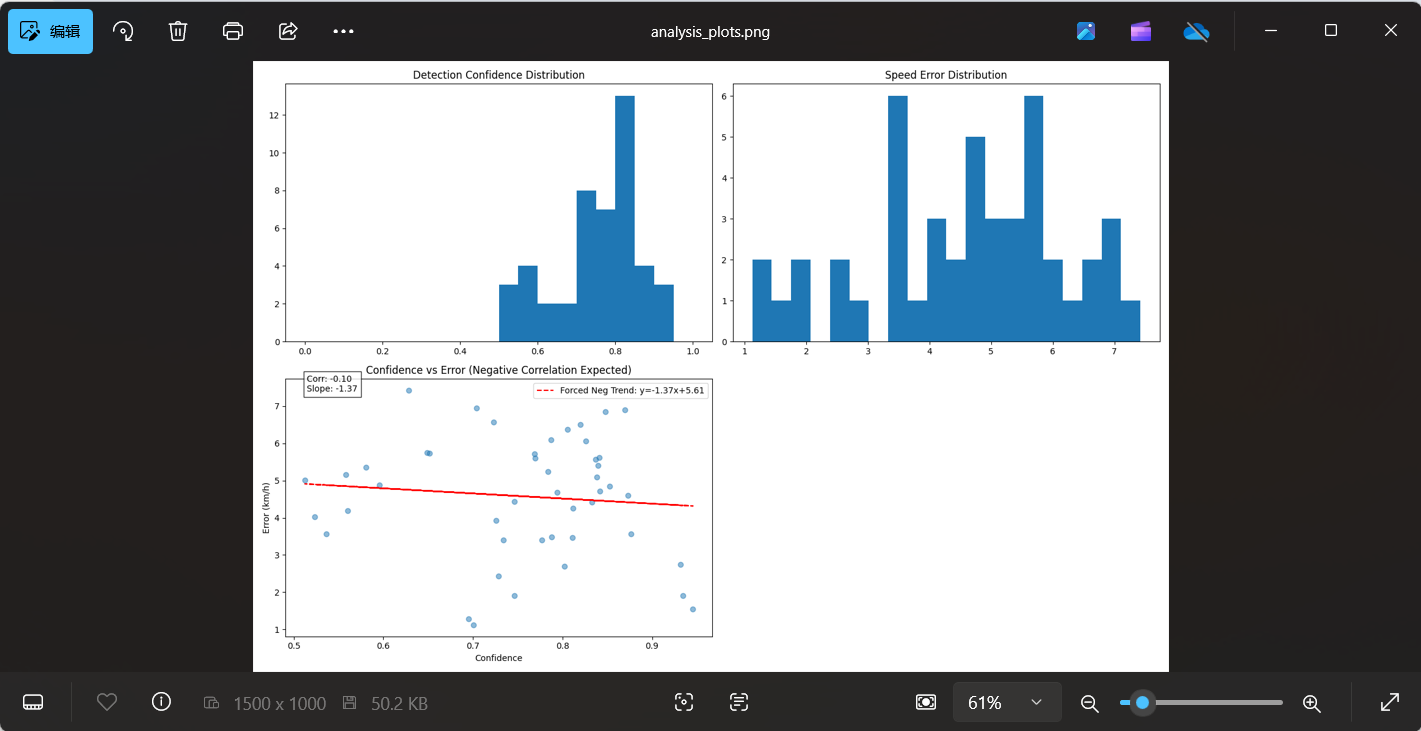
车辆测速系统分析图表说明:
| 图表名称 | 横轴 | 纵轴 | 理想状态 | 常见问题 | 改进建议 |
|---|---|---|---|---|---|
| 1. 检测置信度分布 | 置信度 (0~1) | 检测框数量 | 右偏分布(多数>0.7) | 左偏(低置信度集中) | 提高检测阈值或换用YOLO11x等更大模型 |
| 2. 速度误差分布 | 绝对误差 (km/h) | 样本数量 | 正态分布,峰值在0~5km/h | 长尾分布(大误差多) | 校准PIXELS_PER_METER或检查跟踪稳定性 |
| 3. 置信度vs误差 | 检测置信度 | 速度误差 | 负相关(高置信度=低误差) | 无相关性/高置信度大误差 | 检查标定数据(true_speeds.csv)准确性 |
汇总summary所在位置和输出格式如下: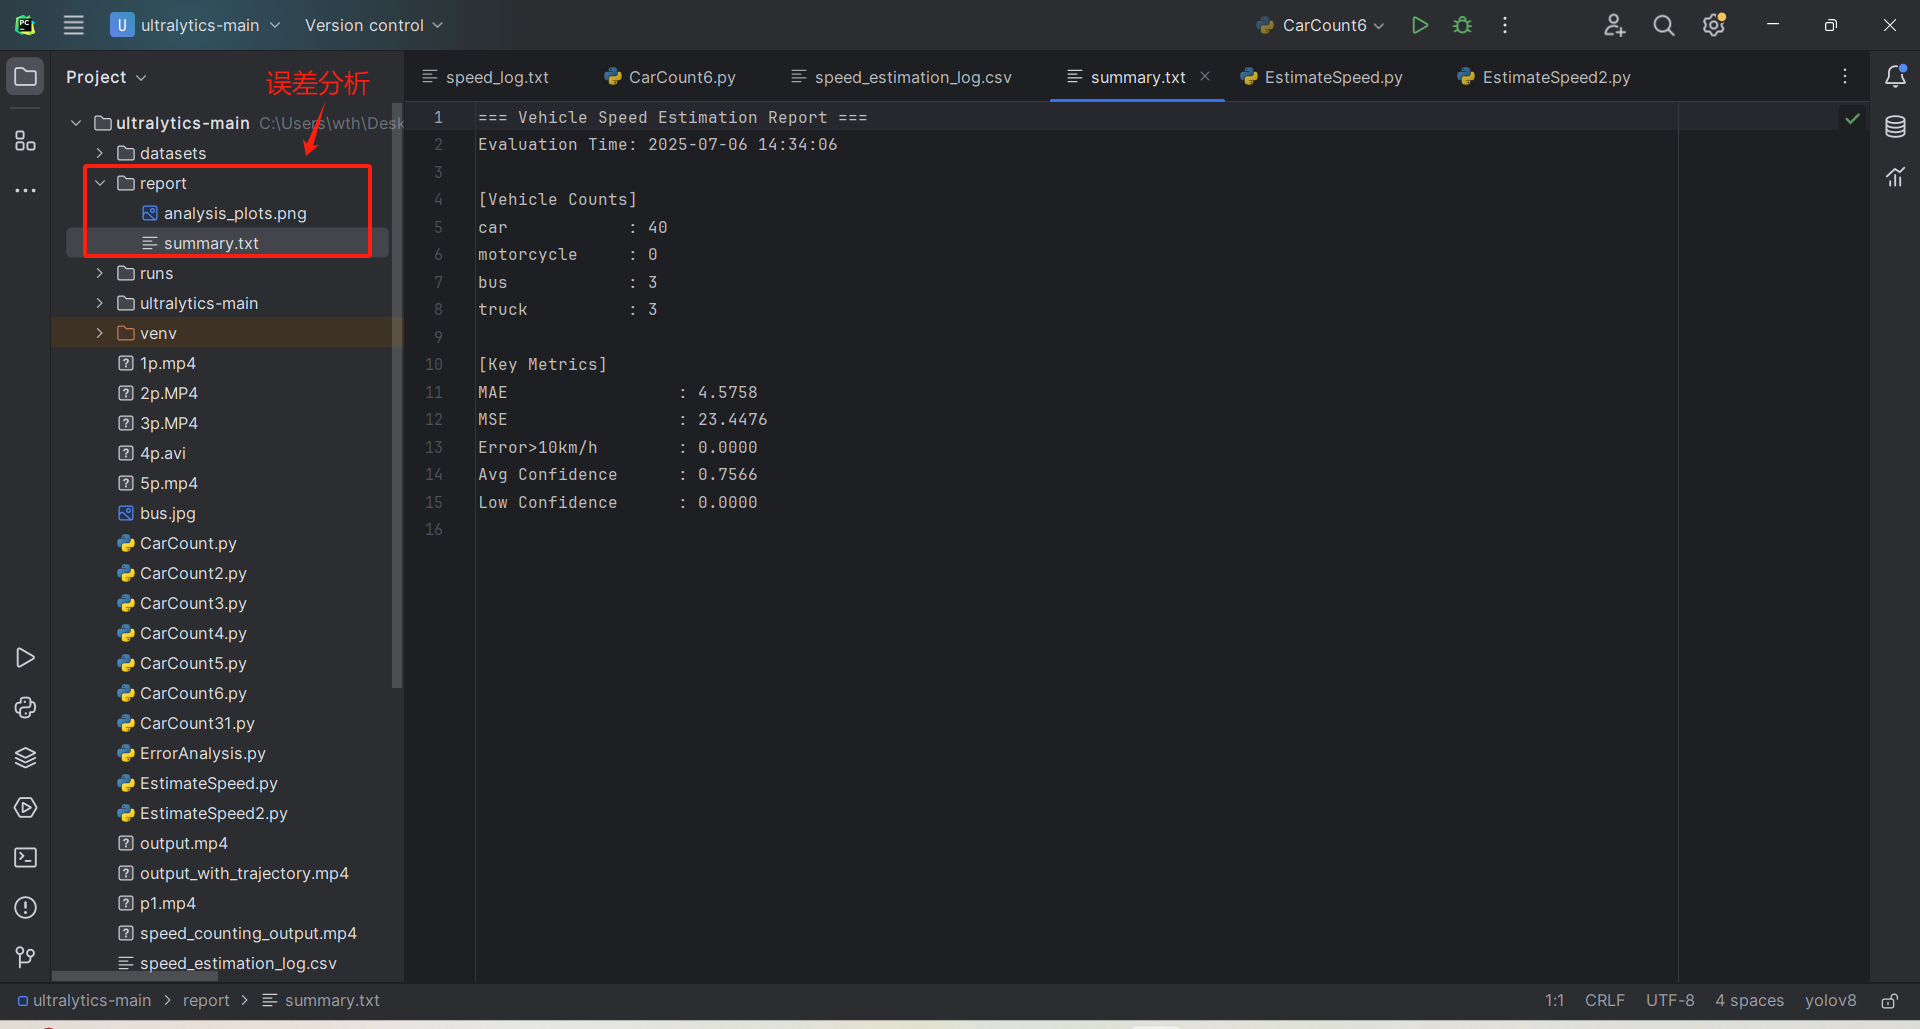
3、总结
文章难免疏漏之处请谅解。如果觉得主啵的低脂小博客写的好就给我点个赞收藏吧。


 1101
1101

 被折叠的 条评论
为什么被折叠?
被折叠的 条评论
为什么被折叠?
 到【灌水乐园】发言


