


1、首先下载openlayer:
npm install ol2.openlayer的主要架构:
地图(Map),图层(Layer),矢量图层(VectorLayer),数据源(source)
2.1首先在开发地图功能时,创建一个容器:
<div ref="map" id="mapContainer"></div>2.2将插件进行引用,openlayer主要有这些常用功能,可进行需求进行引用
import 'ol/ol.css';
import Map from 'ol/Map';
import TileLayer from 'ol/layer/Tile';
import View from 'ol/View';
import { fromLonLat } from 'ol/proj';
import XYZ from 'ol/source/XYZ';
import { Style, Stroke,  Fill , Icon, Circle,Text} from "ol/style";
import VectorLayer from "ol/layer/Vector";
import VectorSource from 'ol/source/Vector';
import GeoJSON from 'ol/format/GeoJSON';
import Feature from 'ol/Feature.js';
import Point from 'ol/geom/Point.js';
import OSM from 'ol/source/OSM.js';
2.3对地图容器进行绘制地图
首先需要一个map,map中主要包括三个元素:target(目标容器),layers(图层),view(视图)三个部分组成
target:不多说
layers:和ps中的图层原理类似,可通过VectorLayer矢量图层进行累计叠加画面,而layers就是最底下最首先显示的一个图层。(我理解是这样的)
view:可对地图的进行一些交互,比如控制缩放比例zoom等
(如果直接url上去无法出现地图,是异步的原因)
data() {
    return {
      mapObj: null,
      mapUrl: 'https://webrd01.is.autonavi.com/appmaptile?lang=zh_cn&size=1&scale=1&style=8&x={x}&y={y}&z={z}', // 确保这个路径是正确的
    };
  },
this.mapObj=new Map({
target:this.$refs.map,
layers:[
new TileLayer({
source:new XYZ({
url:this.mapUrl,
wrapx:false
})
}),
],
view:new View({
//设置地图的中心点
center:[114.28,30,59],
//缩放比例
zoom:12,
//地图投影
projection:'EPSG:4326'
})
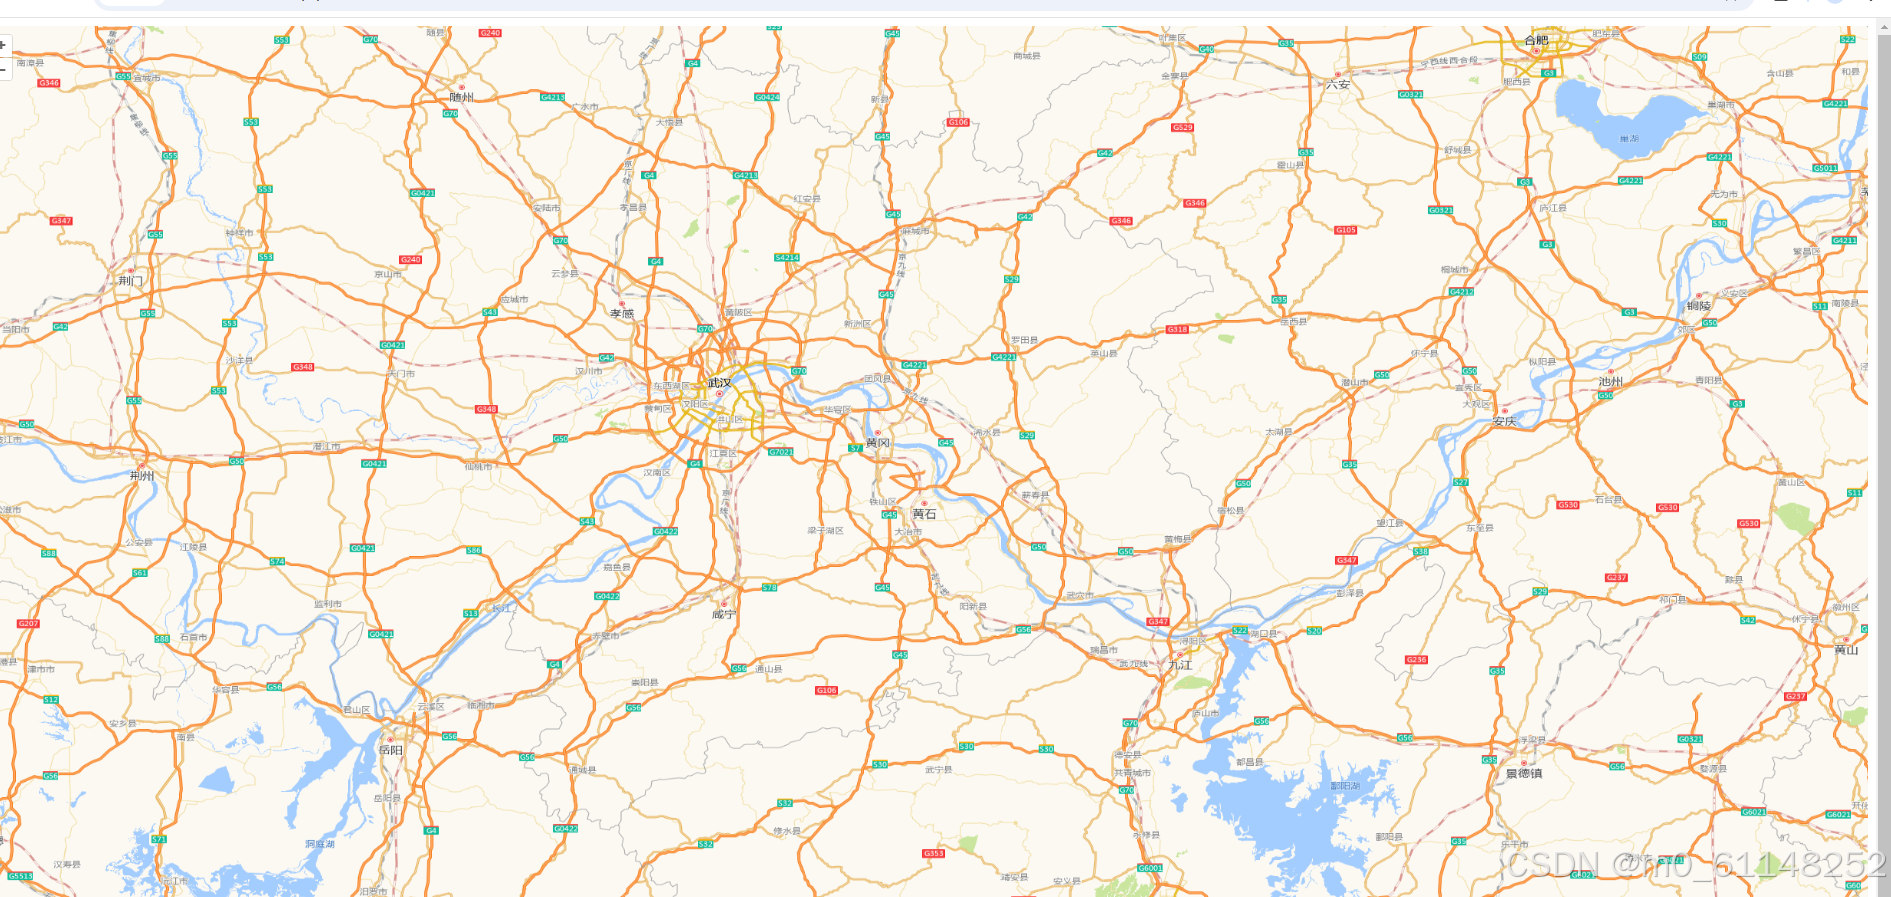
})你一定很困惑为什么不用OSM,而用XYZ,他们都是ol中自带的,因为ol是外国创建的,OSM是国外的资源,所以加载会很慢,而XYZ是国内的加载更快。
这是地图就能出现了
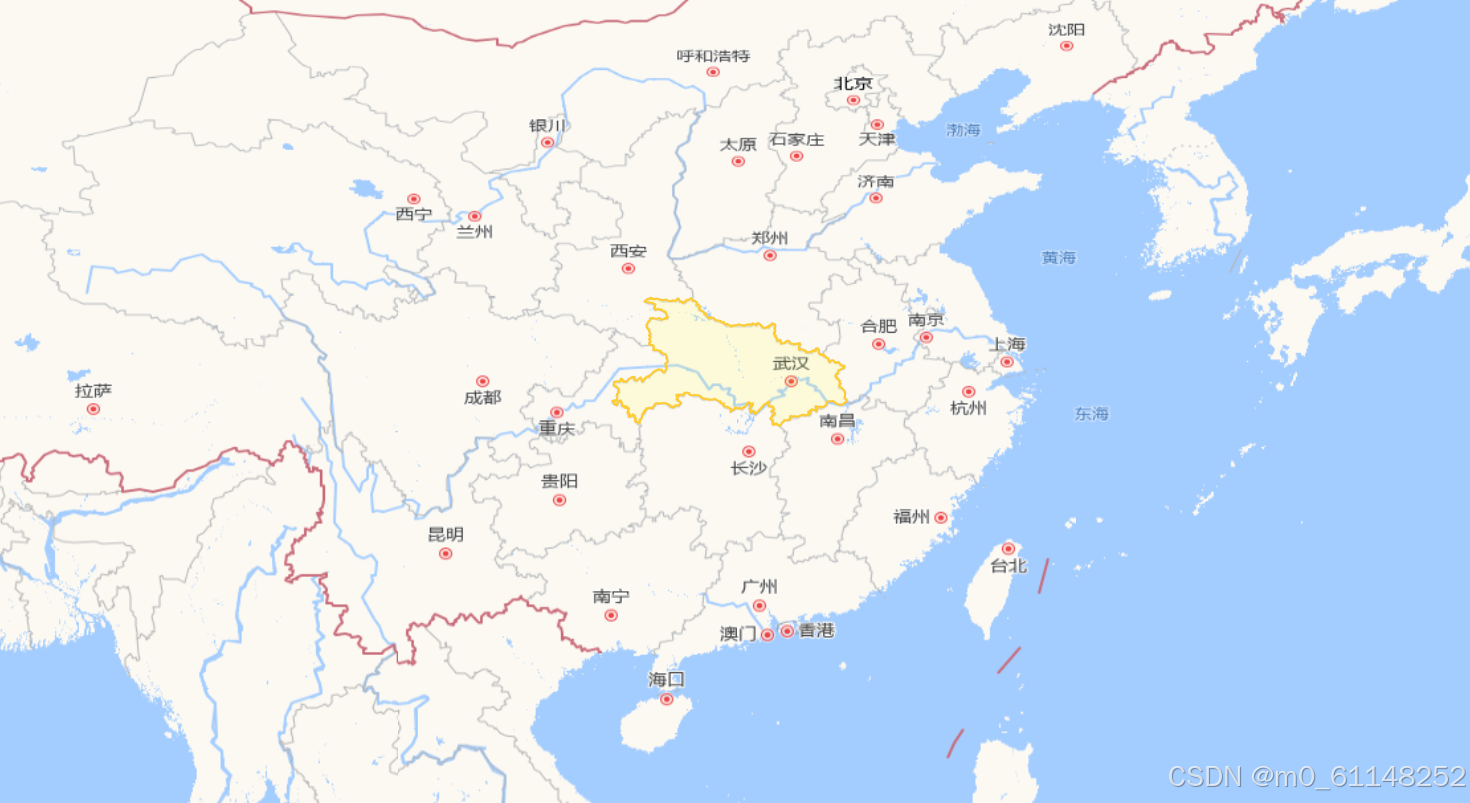
2.4在地图中出现湖北省份的区域,高亮显示
这是就可以使用矢量图层,对图层进行叠加,效果如图显示
如果阿里云的数据出现加载不出来的状况出现403问题再index.html中添加 <meta name="referrer" content="no-referrer" />
this.mapObj=new Map({
      target:this.$refs.map,
      layers:[
        new TileLayer({
          source:new XYZ({
            url:this.mapUrl,
            wrapx:false
          })
        }),
        //矢量图层
        new VectorLayer({
          source:new VectorSource({
            // 阿里云 地图数据
            url:'https://geo.datav.aliyun.com/areas_v3/bound/420000.json',
            // geojson格式
            format:new GeoJSON()
          }),
          // 样式
          style:new Style({
            //   线样式
            stroke:new Stroke({
              color:'#ffcc33',
              width:2
            }),
            //   填充样式
            fill:new Fill({
              color:'rgba(255,255,0,0.1)'
            })
          })
        }),
      ],
      view:new View({
        center:[114.28,30,59],
        zoom:12,
        projection:'EPSG:4326'
      })
    })
2.5这时你就想能不能在省份上对应经纬度上添加点,线,面,图形这样的样式,答案是必须能
添加点
 // 添加元素
   const pointFeature =new Feature({
    //geometry是几何图形,new Point创建点
      geometry:new Point([114.28,30.59])
    })
    // 创建图层
    const pointLayer=new VectorLayer({
      source:new VectorSource({
        // 将点pointFeature 添加到 source中
        features:[pointFeature]
      })
    })
    // 将图层添加到地图中
    this.mapObj.addLayer(pointLayer)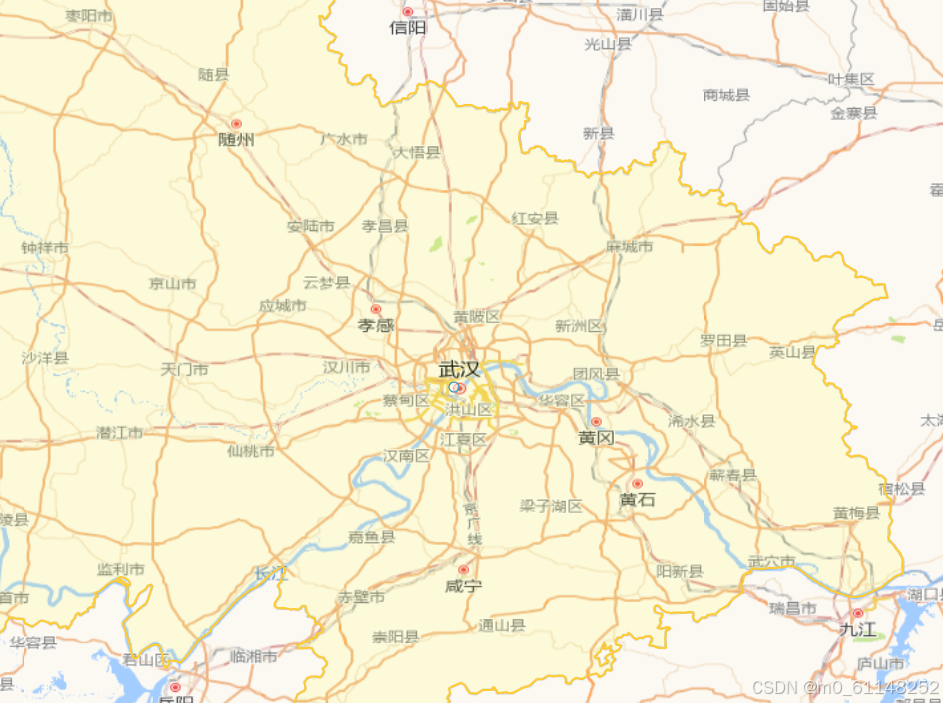
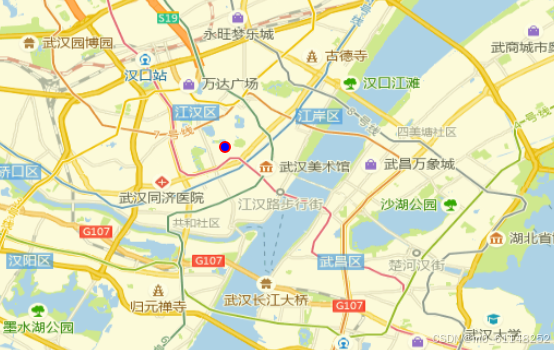
添加点样式
 // 添加元素
   const pointFeature =new Feature({
    //geometry是几何图形,new Point创建点
      geometry:new Point([114.28,30.59])
    })
    pointFeature.setStyle(
      new Style({
        image: new Circle({
          radius: 5,  // 设置圆点的半径
          fill: new Fill({
            color: 'blue'  // 填充颜色
          }),
          stroke: new Stroke({
            color: 'red',  // 描边颜色
            width: 2  // 描边宽度
          })
        })
      })
    )
    // 创建图层
    const pointLayer=new VectorLayer({
      source:new VectorSource({
        // 将点pointFeature 添加到 source中
        features:[pointFeature]
      })
    })
    // 将图层添加到地图中
    this.mapObj.addLayer(pointLayer)
这样样式就添加上去啦
添加线
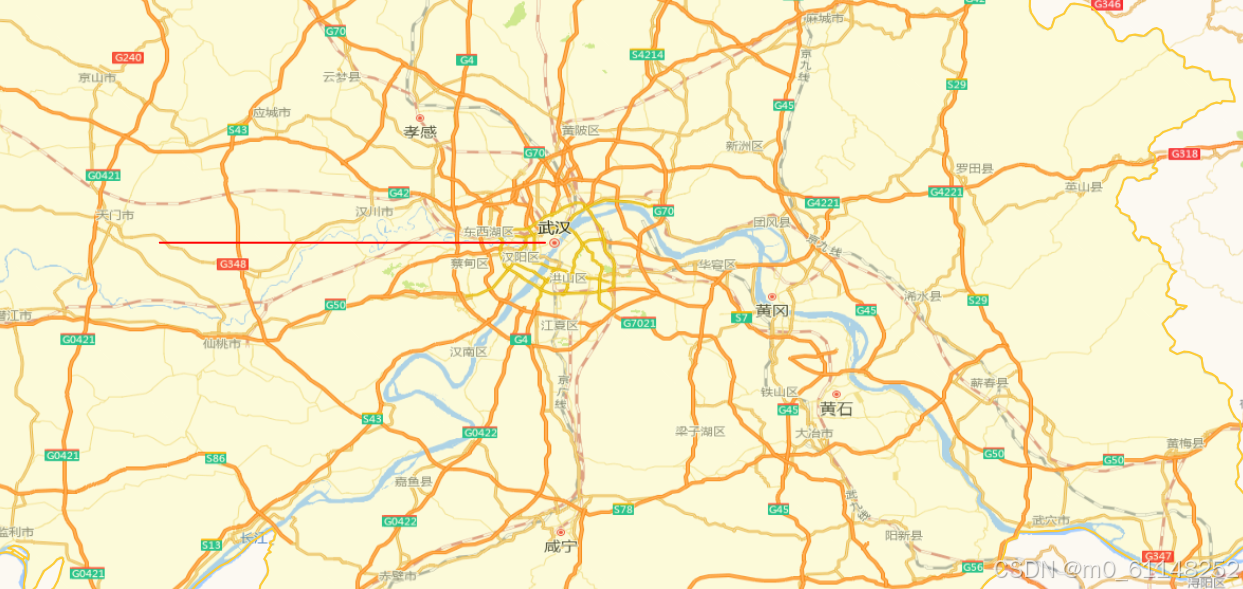
 const lineCoordinates = [
      [114.28, 30.59],
      [113.28, 30.59]
    ];
    // 添加元素
   const pointFeature =new Feature({
    //geometry是几何图形,new Point创建点
      geometry:new LineString(lineCoordinates)
    })
    pointFeature.setStyle(
      new Style({
          stroke: new Stroke({
            color: 'red',  // 描边颜色
            width: 2  // 描边宽度
          })
        })
    )
    // 创建图层
    const pointLayer=new VectorLayer({
      source:new VectorSource({
        // 将点pointFeature 添加到 source中
        features:[pointFeature]
      })
    })
    // 将图层添加到地图中
    this.mapObj.addLayer(pointLayer)
添加图形
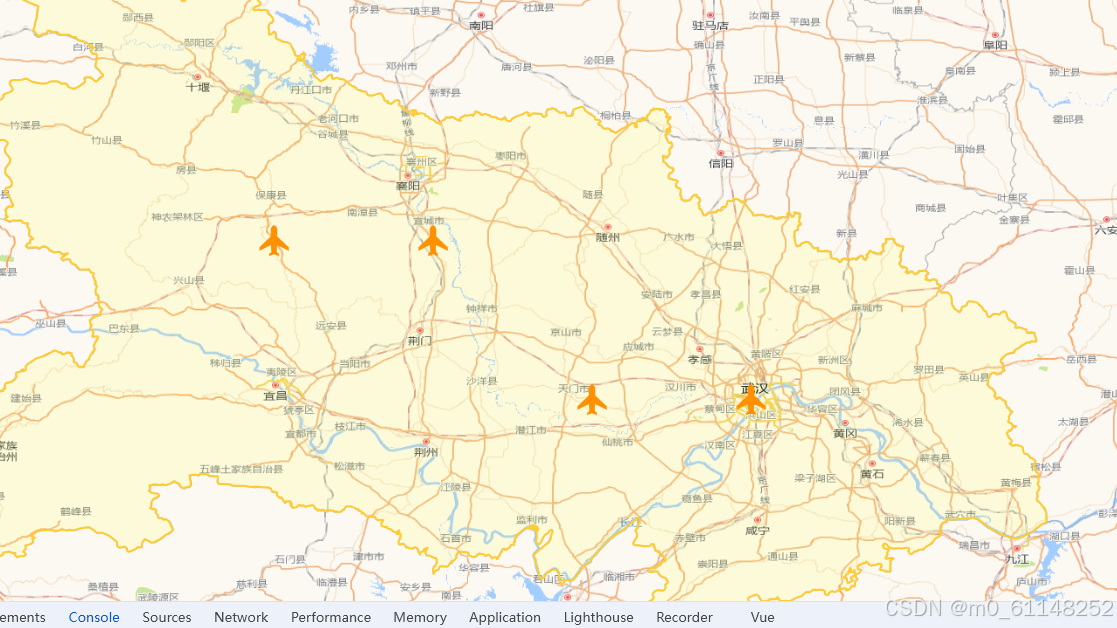
  const coordinates = [
      [114.28, 30.59],
      [113.28, 30.59],
      [112.28, 31.59],  // 添加更多的点
      [111.28, 31.59],  // 添加更多的点
    ];
    // 创建一个数组存储多个 Feature
    const features = coordinates.map(coord => {
      return new Feature({
        geometry: new Point(coord)
      });
    });
    console.log(features,'features');
    features.forEach(item=>{
      item.setStyle(
      new Style({
        image:new Icon({
          src:require('@/assets/plane.png')
        })
      })
    )
    })
    const iconLayer=new VectorLayer({
      source:new VectorSource({
        features:features
      }),
    })
    // 将图层添加到地图中
    this.mapObj.addLayer(iconLayer)
其余部分可查看官网进行自行补充


 5617
5617

 被折叠的 条评论
为什么被折叠?
被折叠的 条评论
为什么被折叠?
 到【灌水乐园】发言


