


本文基于Andrew_Ng的ML课程作业
1-Logistic Regression with gradientDescent:根据申请学生两次测试的评分来决定他们是否被录取
导入库
import numpy as np
import pandas as pd
import matplotlib.pyplot as plt
函数:Sigmoid函数
def sigmoid(z): #Sigmoid函数
    return 1/(1+np.exp(-z))
函数:计算代价函数J(theta)
def computeCost(X,y,theta): #计算代价函数J(theta)
    first=np.multiply(-y,np.log(sigmoid(X*theta.T)+1e-5))
        #epsilon = 1e-5 np.log(P + epsilon):计算log后的数值太大导致数据溢出,因此需要做一下数据精度的处理,这里修改浮点数精度为1e-5
    second=np.multiply((1-y),np.log(1-sigmoid(X*theta.T)+1e-5))
    return np.sum(first-second)/len(X)
函数:梯度下降法
def gradientDescent(X,y,theta,alpha,iters): #梯度下降法
    temp=np.matrix(np.zeros(theta.shape))
    parameters=int(theta.ravel().shape[1])
    cost=np.zeros(iters)
    for i in range(iters):
        error=(sigmoid(X*theta.T))-y
        for j in range(parameters):
            term=np.multiply(error,X[:,j])
            temp[0,j]=theta[0,j]-(alpha/len(X))*np.sum(term)
        theta=temp
        cost[i]=computeCost(X,y,theta)
    return cost,theta
主函数:
# Logistic Regression with gradientDescent:根据申请学生两次测试的评分来决定他们是否被录取
path='ex2data1.txt'
data=pd.read_csv(path,header=None,names=['Exam 1','Exam 2','Admitted'])
positive=data[data['Admitted'].isin([1])]
#test_elements.isin([a]):判断数组element中的元素a是否属于test_elements;若为是返回True,若不是返回False
#最外面又套data:返回False的所有行被删除,返回True的所有行被保留
negative=data[data['Admitted'].isin([0])]
data.insert(0,'Ones',1)
cols=data.shape[1]
X=data.iloc[:,0:cols-1]
y=data.iloc[:,cols-1:cols]
X=np.matrix(X.values)
y=np.matrix(y.values)
theta=np.matrix(np.array([0,0,0]))
alpha=0.0000001
iters=10000
cost,g=gradientDescent(X,y,theta,alpha,iters)
x=np.linspace(30,100,num=100)
f=(-g[0,0]-g[0,1]*x)/g[0,2]
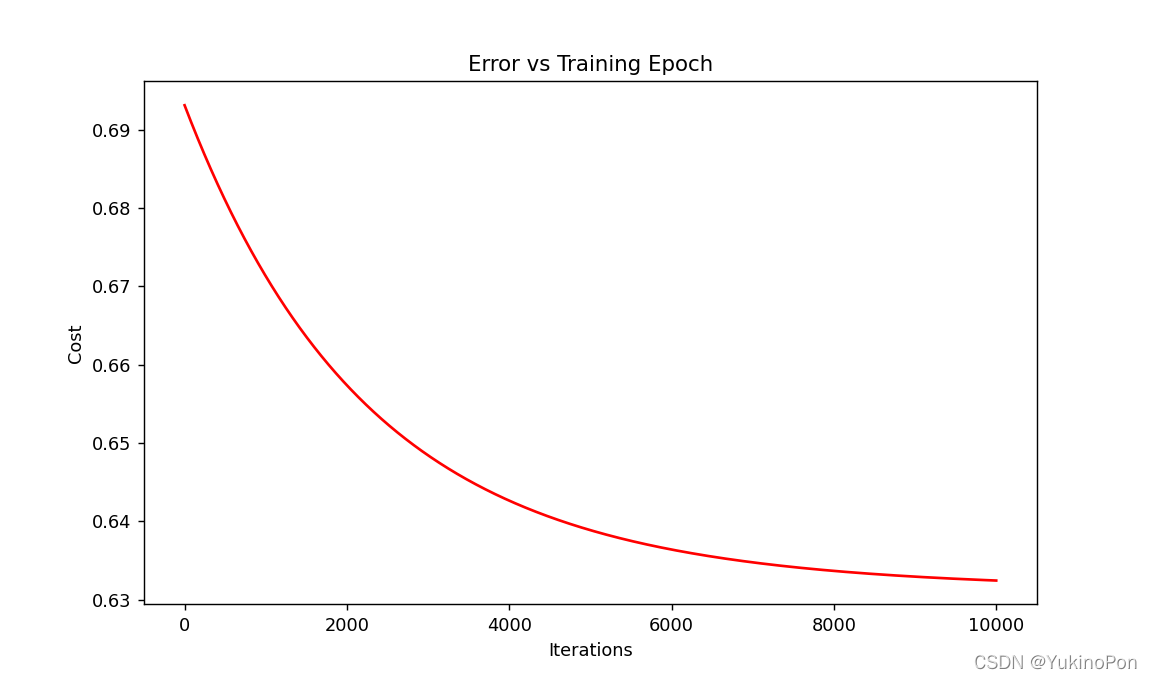
fig2,ax=plt.subplots(figsize=(9,6),dpi=128)
ax.plot(np.arange(iters),cost,'r') #np.arange(n):生成起点为0,终点为n-1的步长为1的排列
ax.set_xlabel('Iterations')
ax.set_ylabel('Cost')
ax.set_title('Error vs Training Epoch')
plt.show()
fig,ax=plt.subplots(figsize=(9,6),dpi=128)
ax.plot(x,f,'y',label='Prediction')
ax.scatter(positive['Exam 1'],positive['Exam 2'],s=50,c='b',marker='o',label="Admitted")
ax.scatter(negative['Exam 1'],negative['Exam 2'],s=50,c='r',marker='x',label='Not Admitted')
ax.legend(loc='upper right')
ax.set_xlabel('Exam 1 Score')
ax.set_ylabel('Exam 2 Score')
plt.show()代价函数-迭代次数
预测结果
 最低0.47元/天 解锁文章


 582
582

 被折叠的 条评论
为什么被折叠?
被折叠的 条评论
为什么被折叠?
 到【灌水乐园】发言


