


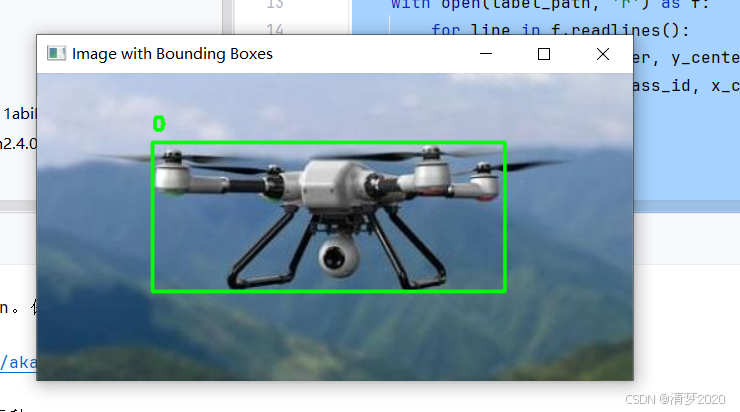
在下载一些数据集后,我们需要使用程序将其他格式的数据集转换为YOLO格式的数据集,但是当转换过来的时候不放心,想要可视化标记是否准确,可以直接用下面的代码。
用法就是在终端中输入
python 你的程序名.py --image 图片文件夹路径 --label 标签文件夹路径代码修改自https://blog.youkuaiyun.com/xiao_9626/article/details/146332133,解决了显示窗口在屏幕外,导致看不到图片。解决显示窗口太大,超出屏幕的情况。 摁空格就可以一直往后检查
import cv2
import argparse
import os
import tkinter as tk

def read_labels(label_path):
    """
    读取YOLO格式的标签文件,返回目标检测框和类别
    :param label_path: 标签文件路径
    :return: list of [class_id, x_center, y_center, width, height]
    """
    boxes = []
    with open(label_path, 'r') as f:
        for line in f.readlines():
            class_id, x_center, y_center, width, height = map(float, line.strip().split())
            boxes.append([class_id, x_center, y_center, width, height])
    return boxes


def draw_boxes(image_path, boxes, class_names):
    """
    在图像上绘制检测框和类别
    :param image_path: 图像路径
    :param boxes: 检测框列表
    :param class_names: 类别名称列表
    """
    image = cv2.imread(image_path)
    height, width, _ = image.shape

    # 获取屏幕的宽度和高度
    root = tk.Tk()
    screen_width = root.winfo_screenwidth()
    screen_height = root.winfo_screenheight()
    root.destroy()

    # 调整窗口大小以适应屏幕
    display_width = min(width, screen_width)
    display_height = min(height, screen_height)

    # 创建窗口并设置窗口大小
    cv2.namedWindow("Image with Bounding Boxes", cv2.WINDOW_NORMAL)
    cv2.resizeWindow("Image with Bounding Boxes", display_width, display_height)

    # 将窗口移动到屏幕左上角
    cv2.moveWindow("Image with Bounding Boxes", 0, 0)

    for box in boxes:
        class_id, x_center, y_center, width_ratio, height_ratio = box
        x_center = int(x_center * width)
        y_center = int(y_center * height)
        box_width = int(width_ratio * width)
        box_height = int(height_ratio * height)

        # 计算左上角和右下角坐标
        x1 = int(x_center - box_width / 2)
        y1 = int(y_center - box_height / 2)
        x2 = int(x_center + box_width / 2)
        y2 = int(y_center + box_height / 2)

        # 绘制矩形框
        cv2.rectangle(image, (x1, y1), (x2, y2), (0, 255, 0), 2)
        # 添加类别名称
        class_name = class_names[int(class_id)]
        cv2.putText(image, class_name, (x1, y1 - 10), cv2.FONT_HERSHEY_SIMPLEX, 0.5, (0, 255, 0), 2)

    # 显示图像
    cv2.imshow("Image with Bounding Boxes", image)
    cv2.waitKey(0)
    cv2.destroyAllWindows()


def main(image_path, label_path, class_names):
    """
    主函数,处理单个图像和标签
    :param image_path: 图像路径
    :param label_path: 标签路径
    :param class_names: 类别名称列表
    """
    if not os.path.exists(image_path):
        print(f"Error: Image file {image_path} does not exist.")
        return

    if not os.path.exists(label_path):
        print(f"Error: Label file {label_path} does not exist.")
        return

    boxes = read_labels(label_path)
    draw_boxes(image_path, boxes, class_names)


if __name__ == "__main__":
    # 使用 argparse 获取命令行参数
    parser = argparse.ArgumentParser(description="Draw bounding boxes on an image based on YOLO labels.")
    parser.add_argument("--image", type=str, default="data/train/images/0367.jpg",
                        help="Path to the image file. Default is 'default_image.jpg'.")
    parser.add_argument("--label", type=str, default="data/train/labels/0367.txt", help="Path to the label file.")
    args = parser.parse_args()

    # 类别名称列表,根据实际情况修改
    class_names = ['0', '1', '2', '3', '4', '5', '6', '7', '8', '9', '10', '11', '12', '13', '14']
    images_list = []
    labels_list = []
    for root, dirs, files in os.walk(args.image):
        for file in files:
            images_list.append(os.path.join(root, file))
    for root, dirs, files in os.walk(args.label):
        for file in files:
            labels_list.append(os.path.join(root, file))
    for i,v in enumerate(images_list):
        main(v, labels_list[i], class_names)


 2056
2056

 被折叠的 条评论
为什么被折叠?
被折叠的 条评论
为什么被折叠?
 到【灌水乐园】发言


