


 本文档介绍如何使用点云库(PointCloudLibrary)对深度图像进行可视化,包括在3D视窗中以点云形式展示和将深度值映射为颜色的彩色图像展示。教程详细解释了代码实现过程,涉及距离图像的生成、参数设置以及实时更新等功能。通过解析命令行参数,可以自定义角度分辨率、坐标框架和实时更新选项。
原文链接:How to visualize a range image — Point Cloud Library 0.0 documentation
range image:
距离图像(range image)的出现对视觉信息处理产生了变革性的影响。与二维图像不同的是,距离图像的像素值代表了三维景物的深度,这使得区域分割、特征抽取、形状复原、景物识别等图像处理工作大为简化。不仅如此,距离图像还使视觉技术真正进入三维接触测量领域。利用距离图像和距离信息重建三维场景较之视觉系统而言,更为精准和简便,重建出来的三维场景对未知环境下移动机器人的自主导航和定位也有着积极的作用。
在这篇教程中,将使用两种不同的方法对一幅深度图像(range image)进行可视化:
- 一种是以点云形式(深度图像来源于点云) 在3D视窗中可视化
- 一种是将深度值映射为颜色,从而以彩色图像形式可视化深度图像
示例源码及解析(解析详见注释):
#include<iostream>

#include<pcl/common/common_headers.h>
#include<pcl/range_image/range_image.h>
#include<pcl/io/pcd_io.h>
#include<pcl/visualization/range_image_visualizer.h>
#include<pcl/visualization/pcl_visualizer.h>
#include<pcl/console/parse.h>//控制台参数解析

typedef pcl::PointXYZ PointType;

// --------------------
// -----设置参数-------
// --------------------

float angular_resolution_x = 0.5f,
		angular_resolution_y = angular_resolution_x;
pcl::RangeImage::CoordinateFrame coordinate_frame =pcl::RangeImage::CAMERA_FRAME;//为0的枚举常量

bool live_update = false;//是否实时更新的标志

// --------------------
// ----打印使用帮助----
// --------------------
void
printUsage(const char* progName)
{
	std::cout<<"\n\nUsage: "<< progName<<"[options] <scene.pcd>\n\n"
		<<"Options:\n"
		<<"-------------------------------------------------\n"
		<< "-rx <float>  angular resolution in degrees (default " << angular_resolution_x << ")\n"
		<< "-ry <float>  angular resolution in degrees (default " << angular_resolution_y << ")\n"
		<< "-c <int>     coordinate frame (default " << (int)coordinate_frame << ")\n"
		<< "-l           live update - update the range image according to the selected view in the 3D viewer.\n"
		<< "-h           this help\n"
		<< "\n\n";
}

//给3D视窗viewer设置观察角度
void setViewerPose(pcl::visualization::PCLVisualizer& viewer, const Eigen::Affine3f& viewer_pose)
{
	Eigen::Vector3f pos_vector = viewer_pose * Eigen::Vector3f(0, 0, 0);
	Eigen::Vector3f look_at_vector = viewer_pose.rotation()*Eigen::Vector3f(0, 0, 1) + pos_vector;
	Eigen::Vector3f up_vector = viewer_pose.rotation() * Eigen::Vector3f(0, -1, 0);
	// 使用给定的参数设置相机的位置,视窗等
	viewer.setCameraPosition(
		pos_vector[0], pos_vector[1], pos_vector[2],
		look_at_vector[0], look_at_vector[1], look_at_vector[2],
		up_vector[0], up_vector[1], up_vector[2]);
}

//主函数
int
main(int argc, char** argv)
{
	// ------------------------------------------------------------------
	// -----------------------命令行参数解析---------------------------
	// ------------------------------------------------------------------

	//find_argument函数:查找命令行中是否有输入某命令,没有的话返回-1,有的话返回其起始下标
	if (pcl::console::find_argument(argc, argv, "-h") >= 0)
	{
		printUsage(argv[0]);//argv[0]指向程序运行的全路径名
		return 0;
	}
	if (pcl::console::find_argument(argc, argv, "-l") >= 0)
	{
		live_update = true;//实时更新开关,从3D视窗中被选中的视图,实时更新到深度图像
		std::cout << "Live update is on\n";
	}
	//parse函数:返回值同find_argument函数,将命令之后的参数解析到传入的引用参数
	if (pcl::console::parse(argc, argv, "-rx", angular_resolution_x) >= 0)
		std::cout << "Setting angular resolution in x-direction to " << angular_resolution_x << "deg.\n";
	if (pcl::console::parse(argc, argv, "-ry", angular_resolution_y) >= 0)
		std::cout << "Setting angular resolution in y-direction to " << angular_resolution_y << "deg.\n";
	int tmp_coordinate_frame;
	if (pcl::console::parse(argc, argv, "-c", tmp_coordinate_frame) >= 0)
	{
		coordinate_frame = pcl::RangeImage::CoordinateFrame(tmp_coordinate_frame);
		std::cout << "Using coordinate frame " << (int)coordinate_frame << ".\n";
	}

	//度转弧度
	angular_resolution_x = pcl::deg2rad(angular_resolution_x);
	angular_resolution_y = pcl::deg2rad(angular_resolution_y);


	// ------------------------------------------------------------------
	// ------------------读取pcd文件,如果不存在则创建点云数据-----------
	// ------------------------------------------------------------------
	pcl::PointCloud<PointType>::Ptr point_cloud_ptr(new pcl::PointCloud<PointType>);
	pcl::PointCloud<PointType>& point_cloud = *point_cloud_ptr;
	Eigen::Affine3f scene_sensor_pose(Eigen::Affine3f::Identity());
	//解析pcd文件名
	std::vector<int> pcd_filename_indeces = pcl::console::parse_file_extension_argument(argc,argv,"pcd");
	//如果解析结果不为空,说明使用本地pcd文件
	if (!pcd_filename_indeces.empty())
	{
		std::string filename = argv[pcd_filename_indeces[0]];
		//如果文件读取失败,直接退出
		if (pcl::io::loadPCDFile(filename, point_cloud) == -1)
		{
			std::cout << "Was not able to open file \"" << filename << "\".\n";
			printUsage(argv[0]);//argv[0]是程序的路径全称
			return 0;
		}
		scene_sensor_pose = Eigen::Affine3f(Eigen::Translation3f(point_cloud.sensor_origin_[0],
			point_cloud.sensor_origin_[1],
			point_cloud.sensor_origin_[2])) *
			Eigen::Affine3f(point_cloud.sensor_orientation_);
	}
	else//解析结果为空,自己创建点云
	{
		std::cout << "\nNo *.pcd file given => Genereating example cloud.\n\n";
		for (float x = -0.5f; x <= 0.5f; x += 0.01f)
		{
			for (float y = -0.5f; y <= 0.5f; y += 0.01f)
			{
				PointType point; point.x = x; point.y = y, point.z = 2.0f - y;
				point_cloud.points.push_back(point);
			}
		}
		point_cloud.width = point_cloud.size();
		point_cloud.height = 1;//无序点云
	}

	// -----------------------------------------------
	// --------------为点云数据创建深度图像-----------
	// -----------------------------------------------
	//
	float noise_level = 0.0;
	float min_range = 0.0f;
	int border_size = 1;
	pcl::RangeImage::Ptr range_image_ptr(new pcl::RangeImage);
	pcl::RangeImage& range_image = *range_image_ptr;
	range_image.createFromPointCloud(point_cloud, angular_resolution_x, angular_resolution_y,
		pcl::deg2rad(360.0f), pcl::deg2rad(180.f), scene_sensor_pose, coordinate_frame, noise_level, min_range, border_size);
	// -----------------------------------------------
	// -------------打开3D视窗并添加点云--------------
	// -----------------------------------------------
	pcl::visualization::PCLVisualizer viewer("3D Viewer");//创建窗口,并设置名字为3D Viewer
	viewer.setBackgroundColor(1, 1, 1);//设置背景颜色,白色
	/**
	 * 添加颜色为黑色,point size为1的深度图像
	 */
	pcl::visualization::PointCloudColorHandlerCustom < pcl::PointWithRange>range_image_color_handler(range_image_ptr, 0, 0, 0);
	viewer.addPointCloud(range_image_ptr, range_image_color_handler, "range image");
	viewer.setPointCloudRenderingProperties(pcl::visualization::PCL_VISUALIZER_POINT_SIZE, 1, "range image");
	/**
	 * 添加一个坐标系,并可视化原始点云
	 */
	//viewer.addCoordinateSystem(1.0f, "global");
	//pcl::visualization::PointCloudColorHandlerCustom<PointType> point_cloud_color_handler(point_cloud_ptr, 150, 150, 150);
	//viewer.addPointCloud(point_cloud_ptr, point_cloud_color_handler, "original point cloud");)
	viewer.initCameraParameters();
	/**
	 * setViewerPose,将视窗的查看位置设置为深度图像中的传感器位置
	 */
	setViewerPose(viewer, range_image.getTransformationToWorldSystem());

	// -----------------------------------------------
	// -----------------显示深度图像------------------
	// -----------------------------------------------
	pcl::visualization::RangeImageVisualizer range_image_wiget("Range Image");
	range_image_wiget.showRangeImage(range_image);
	//--------------------
	// -----Main loop-----
	//--------------------
	while (!viewer.wasStopped())
	{
		range_image_wiget.spinOnce();//处理深度图像可视化类
		viewer.spinOnce();//处理3D窗口的当前事件
		pcl_sleep(0.01);

		//实时更新2D深度图像,以响应可视化窗口中的当前视角,通过命令 -l 来激活
		if (live_update)
		{
			scene_sensor_pose = viewer.getViewerPose();
			range_image.createFromPointCloud(point_cloud,angular_resolution_x,angular_resolution_y,
				pcl::deg2rad(360.0f),pcl::deg2rad(180.0f), scene_sensor_pose, pcl::RangeImage::LASER_FRAME, noise_level, min_range, border_size);
			range_image_wiget.showRangeImage(range_image);
		}

	}
}
关键代码
上述代码的主要功能就是使用点云生成深度图像并显示。
显示方法采用了两种窗体:
- RangeImageVisualizer
- PCLVisualizer
1.使用点云生成深度图像
 float noise_level = 0.0;
  float min_range = 0.0f;
  int border_size = 1;
  pcl::RangeImage::Ptr range_image_ptr(new pcl::RangeImage);
  pcl::RangeImage& range_image = *range_image_ptr;
  range_image.createFromPointCloud (point_cloud, angular_resolution_x, angular_resolution_y,
                                    pcl::deg2rad (360.0f), pcl::deg2rad (180.0f),
scene_sensor_pose, coordinate_frame, noise_level, min_range, border_size);方法很简单,使用RangeImage自带的createFromPointCloud()函数,该函数的第一个参数为点云数据,其他传入的参数为控制显示的变量,都设有默认值,其函数头:
      /** \brief Create the depth image from a point cloud
        * \param point_cloud the input point cloud
        * \param angular_resolution the angular difference (in radians) between the individual pixels in the image
        * \param max_angle_width an angle (in radians) defining the horizontal bounds of the sensor
        * \param max_angle_height an angle (in radians) defining the vertical bounds of the sensor
        * \param sensor_pose an affine matrix defining the pose of the sensor (defaults to
        *                    Eigen::Affine3f::Identity () )
        * \param coordinate_frame the coordinate frame (defaults to CAMERA_FRAME)
        * \param noise_level - The distance in meters inside of which the z-buffer will not use the minimum,
        *                      but the mean of the points. If 0.0 it is equivalent to a normal z-buffer and
        *                      will always take the minimum per cell.
        * \param min_range the minimum visible range (defaults to 0)
        * \param border_size the border size (defaults to 0)
        */
      template <typename PointCloudType> void
      createFromPointCloud (const PointCloudType& point_cloud, float angular_resolution=pcl::deg2rad (0.5f),
          float max_angle_width=pcl::deg2rad (360.0f), float max_angle_height=pcl::deg2rad (180.0f),
          const Eigen::Affine3f& sensor_pose = Eigen::Affine3f::Identity (),
          CoordinateFrame coordinate_frame=CAMERA_FRAME, float noise_level=0.0f,
          float min_range=0.0f, int border_size=0);
2.使用PCLVisualizer类来显示深度图像
这将创建 3D 查看器PCLVisualizer对象,将背景颜色设置为白色,添加颜色为黑色且点大小为 1 的范围图像(作为点云),并将查看器中的查看位置设置为距离图像中的传感器位置(使用setViewerPose函数)。 注释部分可用于添加坐标系并可视化原始点云。
pcl::visualization::PCLVisualizer viewer ("3D Viewer");
viewer.setBackgroundColor (1, 1, 1);
pcl::visualization::PointCloudColorHandlerCustom<pcl::PointWithRange> range_image_color_handler (range_image_ptr, 0, 0, 0);
viewer.addPointCloud (range_image_ptr, range_image_color_handler, "range image");
viewer.setPointCloudRenderingProperties (pcl::visualization::PCL_VISUALIZER_POINT_SIZE, 1, "range image");
//viewer.addCoordinateSystem (1.0f);
//pcl::visualization::PointCloudColorHandlerCustom<PointType> point_cloud_color_handler (point_cloud_ptr, 150, 150, 150);
//viewer.addPointCloud (point_cloud_ptr, point_cloud_color_handler, "original point cloud");
viewer.initCameraParameters ();
setViewerPose(viewer, range_image.getTransformationToWorldSystem ());
3,使用RangeImageVisualizer查看深度图像
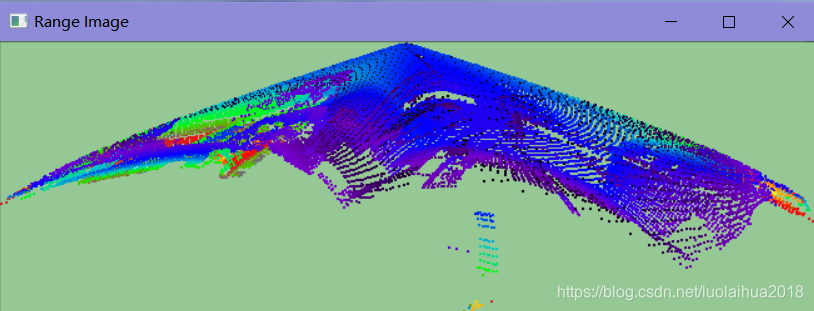
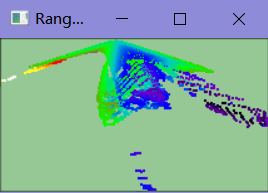
在RangeImageVisualizer查看器中查看2D的深度图像,对深度使用颜色编码。
pcl::visualization::RangeImageVisualizer range_image_widget ("Range image");
  range_image_widget.showRangeImage (range_image);
运行示例
使用命令行运行程序:

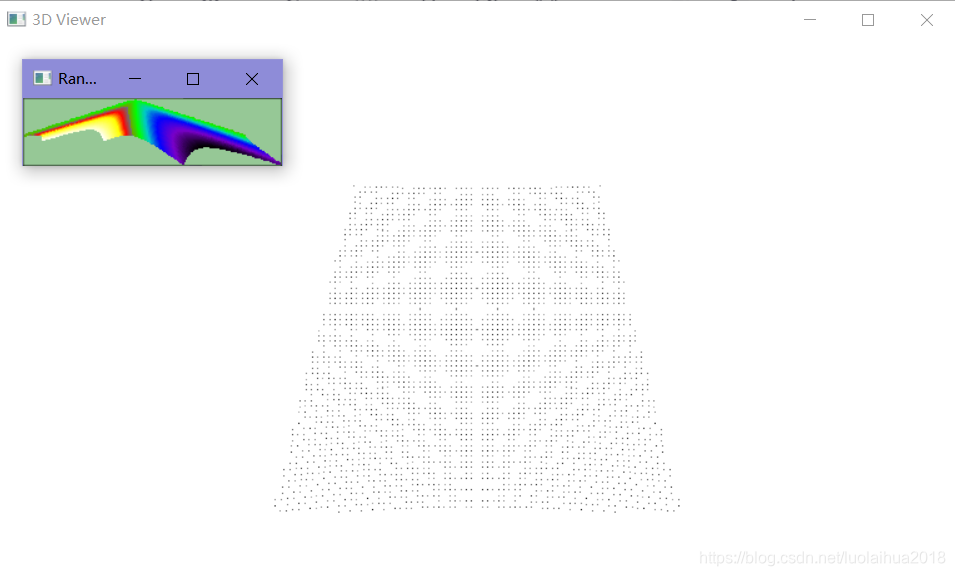
输入命令:range_image_visualization.exe -l
表示打开实时显示深度图像,没有读取pcd文件,使用的是程序生成的阵列点云。
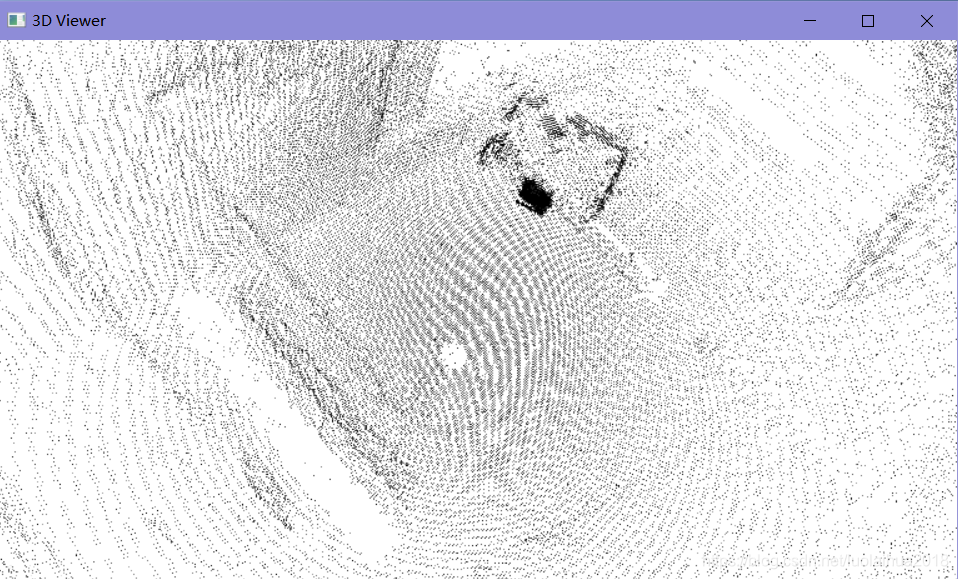
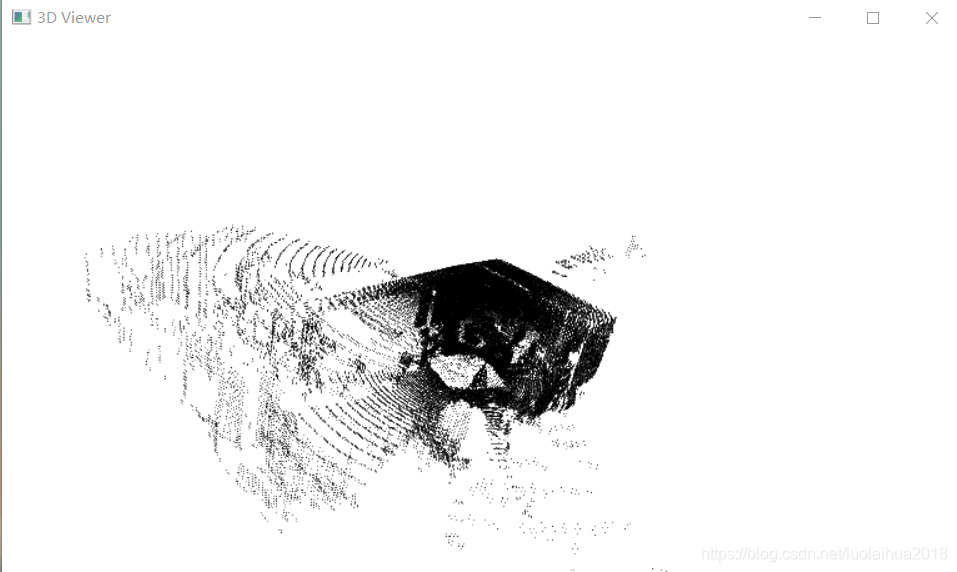
读取room_scan1.pcd文件并显示:
pcd文件下载链接:pcl-project/room_scan1.pcd at master · luolaihua/pcl-project · GitHub
![]()
功能函数解析
设置相机的位姿函数:
        /** \brief Set the camera pose given by position, viewpoint and up vector
          * \param[in] pos_x the x coordinate of the camera location
          * \param[in] pos_y the y coordinate of the camera location
          * \param[in] pos_z the z coordinate of the camera location
          * \param[in] view_x the x component of the view point of the camera
          * \param[in] view_y the y component of the view point of the camera
          * \param[in] view_z the z component of the view point of the camera
          * \param[in] up_x the x component of the view up direction of the camera
          * \param[in] up_y the y component of the view up direction of the camera
          * \param[in] up_z the y component of the view up direction of the camera
          * \param[in] viewport the viewport to modify camera of (0 modifies all cameras)
          */
        void
        setCameraPosition (double pos_x, double pos_y, double pos_z,
                           double view_x, double view_y, double view_z,
                           double up_x, double up_y, double up_z, int viewport = 0);
控制台参数解析函数
    /** \brief Finds the position of the argument with name "argument_name" in the argument list "argv"
      * \param[in] argc the number of command line arguments
      * \param[in] argv the command line arguments
      * \param[in] argument_name the string value to search for
      * \return index of found argument or -1 if arguments do not appear in list
     */
    PCL_EXPORTS int
    find_argument (int argc, char** argv, const char* argument_name);

    /** \brief Template version for parsing arguments. Template parameter needs to have input stream operator overloaded!
      * \param[in] argc the number of command line arguments
      * \param[in] argv the command line arguments
      * \param[in] argument_name the name of the argument to search for
      * \param[out] value The value of the argument
      * \return index of found argument or -1 if arguments do not appear in list
     */
    template<typename Type> int
    parse (int argc, char** argv, const char* argument_name, Type& value)
    {
      int index = find_argument (argc, argv, argument_name) + 1;

      if (index > 0 && index < argc)
      {
        std::istringstream stream;
        stream.clear ();
        stream.str (argv[index]);
        stream >> value;
      }

      return (index - 1);
    }
解析命令行中的文件名函数
    /** \brief Parse command line arguments for file names with given extension
      * \param[in] argc the number of command line arguments
      * \param[in] argv the command line arguments
      * \param[in] ext the extension to search for
      * \return a vector with file names indices
      */
    PCL_EXPORTS std::vector<int>
    parse_file_extension_argument (int argc, char** argv, const std::string &ext);
  }


 369
369

 被折叠的 条评论
为什么被折叠?
被折叠的 条评论
为什么被折叠?
 到【灌水乐园】发言


